

Question: just one question pls answer A study compared three display panels used by air traffic controllers. Each display panel was tested for four different simulated
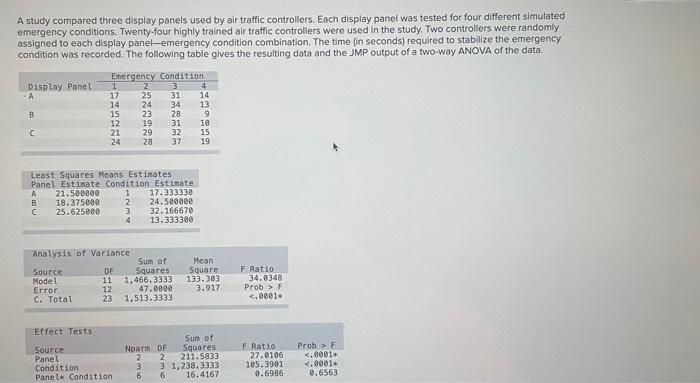
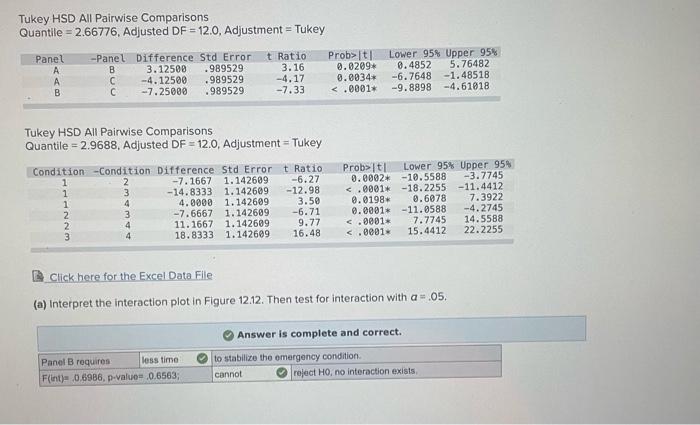
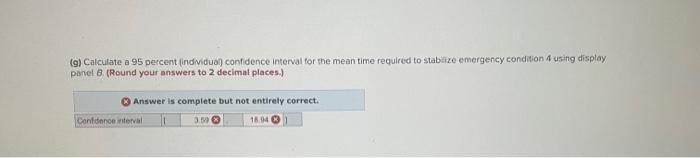
A study compared three display panels used by air traffic controllers. Each display panel was tested for four different simulated emergency conditions. Twenty-four highly trained air traftic controllers were used in the study. Two controllers were randomly assigned to each display panel-emergency condition combination. The time (in seconds) required to stabilize the emergency condition was recorded. The following table glves the resulting data and the JMP output of a two-way ANOVA of the data. Tukey HSD All Pairwise Comparisons Quantile =2.66776, Adjusted DF=12.0, Adjustment = Tukey Tukey HSD All Pairwise Comparisons Quantile =2.9688, Adjusted DF =12.0, Adjustment = Tukey [A Click here for the Excel Data File (a) Interpret the interaction plot in Figure 12.12. Then test for interaction with a=.05. (g) Calculate a 95 peicent (indidual) confidence interval for the mean time required to stabizze emergency condition 4 using display panel B. (Round your answers to 2 decimal places.)
Step by Step Solution
There are 3 Steps involved in it

Get step-by-step solutions from verified subject matter experts