

Question: pls help only 2 points missing A study compared three display panels used by air traffic controllers. Each display panel was tested for four different
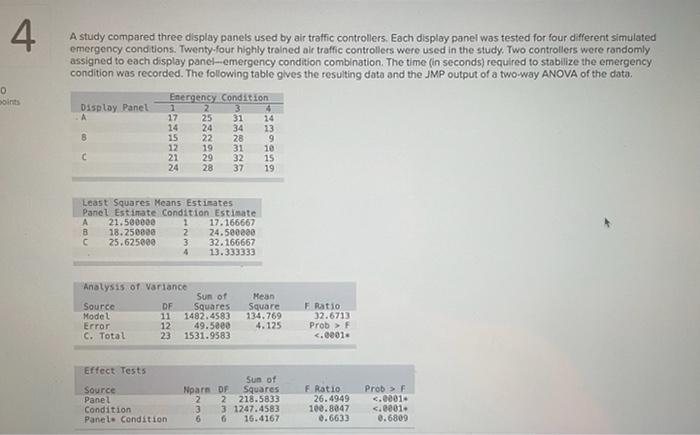
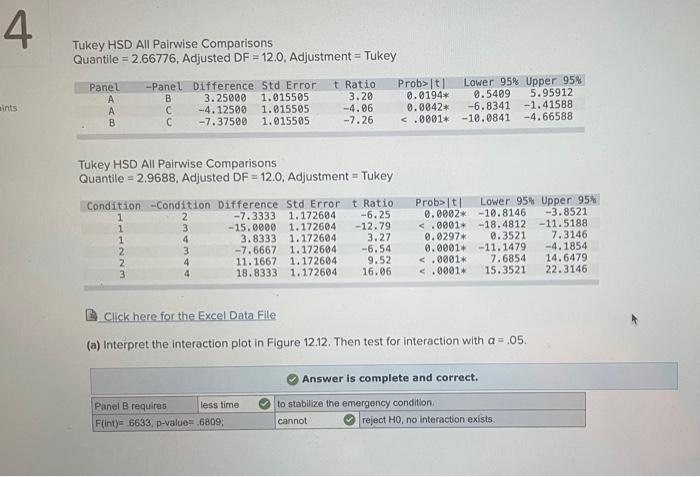
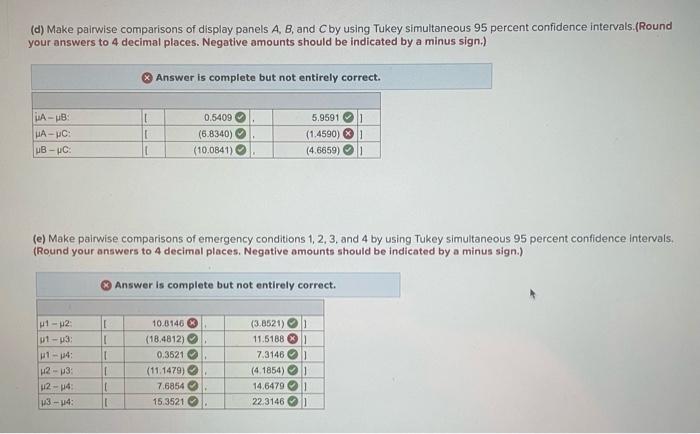
A study compared three display panels used by air traffic controllers. Each display panel was tested for four different simulated emergency conditions. Twenty. four highly trained air traffic controllers were used in the study. Two controllers were randomly assigned to each display panel-emergency condition combination. The time (in seconds) required to stabilize the emergency condition was recorded. The following table glves the resulting data and the JMP output of a two-way ANOVA of the data. Tukey HSD All Pairwise Comparisons Quantile =2.66776, Adjusted DF = 12.0. Adjustment = Tukey Tukey HSD All Pairwise Comparisons Quantile = 2.9688, Adjusted DF = 12.0, Adjustment = Tukey (3) Click here for the Excel Data File (a) Interpret the interaction plot in Figure 12:12. Then test for interaction with a=.05. (d) Make pairwise comparisons of display panels A, B, and C by using Tukey simultaneous 95 percent confidence intervals.(Round your answers to 4 decimal places. Negative amounts should be indicated by a minus sign.) (e) Make pairwise comparisons of emergency conditions 1, 2, 3, and 4 by using Tukey simultaneous 95 percent confidence intervals. (Round your answers to 4 decimal places. Negative amounts should be indicated by a minus sign.) Answer is complete but not entirely correct. A study compared three display panels used by air traffic controllers. Each display panel was tested for four different simulated emergency conditions. Twenty. four highly trained air traffic controllers were used in the study. Two controllers were randomly assigned to each display panel-emergency condition combination. The time (in seconds) required to stabilize the emergency condition was recorded. The following table glves the resulting data and the JMP output of a two-way ANOVA of the data. Tukey HSD All Pairwise Comparisons Quantile =2.66776, Adjusted DF = 12.0. Adjustment = Tukey Tukey HSD All Pairwise Comparisons Quantile = 2.9688, Adjusted DF = 12.0, Adjustment = Tukey (3) Click here for the Excel Data File (a) Interpret the interaction plot in Figure 12:12. Then test for interaction with a=.05. (d) Make pairwise comparisons of display panels A, B, and C by using Tukey simultaneous 95 percent confidence intervals.(Round your answers to 4 decimal places. Negative amounts should be indicated by a minus sign.) (e) Make pairwise comparisons of emergency conditions 1, 2, 3, and 4 by using Tukey simultaneous 95 percent confidence intervals. (Round your answers to 4 decimal places. Negative amounts should be indicated by a minus sign.) Answer is complete but not entirely correct
Step by Step Solution
There are 3 Steps involved in it

Get step-by-step solutions from verified subject matter experts