

Question: just the answer Year, x The table lists the average monthly cost to workers for family health insurance for various years. a) Use a graphing
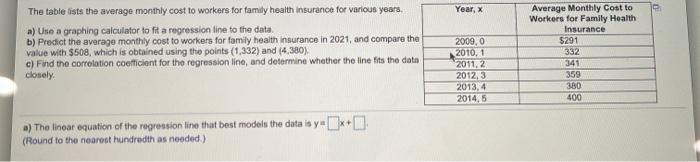
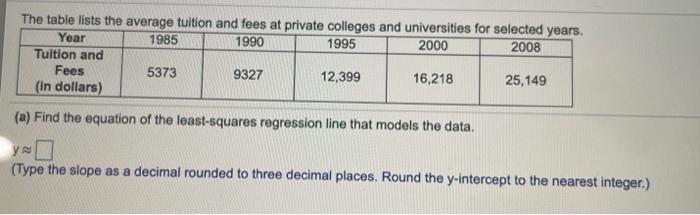
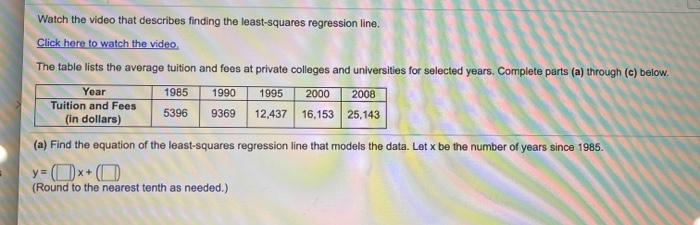
Year, x The table lists the average monthly cost to workers for family health insurance for various years. a) Use a graphing calculator to fit a regression line to the data b) Predict the average monthly cost to workers for family health insurance in 2021, and compare the value with $508, which is obtained using the points (1,332) and (4,380) c) Find the correlation coefficient for the regression line, and determine whether the line fits the data closely 2009, 0 2010.1 2011,2 2012,3 2013,4 2014,5 Average Monthly Cost to Workers for Family Health Insurance 5291 332 341 359 380 400 a) The linear equation of the repression line that best models the data is y- Ox+ (Round to the nearest hundredth as needed) The table lists the average tuition and fees at private colleges and universities for selected years. Year 1985 1990 1995 2000 2008 Tuition and Fees 5373 9327 12,399 16,218 25,149 (in dollars) (a) Find the equation of the least-squares regression line that models the data. ye (Type the slope as a decimal rounded to three decimal places. Round the y-intercept to the nearest integer.) Watch the video that describes finding the least-squares regression line. Click here to watch the video The table lists the average tuition and fees at private colleges and universities for selected years. Complete parts (a) through (e) below. 1985 1990 1995 2000 2008 5396 9369 (in dollars) 12,437 16.153 25,143 (a) Find the equation of the least-squares regression line that models the data. Let x be the number of years since 1985. y=((x+ (O (Round to the nearest tenth as needed.) Year Tuition and Fees
Step by Step Solution
There are 3 Steps involved in it

Get step-by-step solutions from verified subject matter experts