

Question: The table lists the average monthly cost to workers for family health insurance for various years. a) Use a graphing calculator to fit a regression
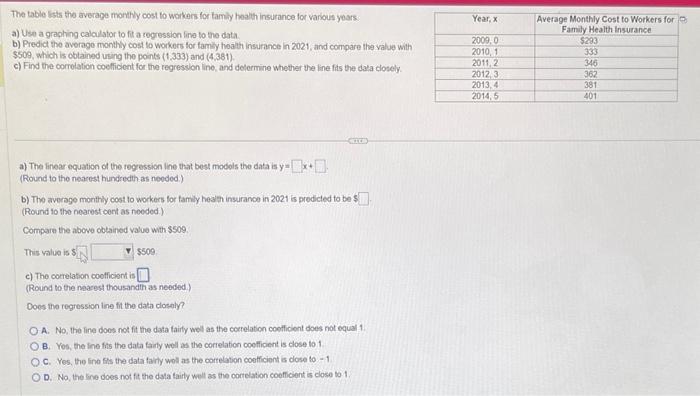
The table lists the average monthly cost to workers for family health insurance for various years.
a) Use a graphing calculator to fit a regression line to the data.
b) Predict the average monthly cost to workers for family health insurance in 2021, and compare the value with
$509, which is obtained using the points (1,333) and (4,381).
c) Find the correlation coefficient for the regression line, and determine whether the line fits the data closely.
Step by Step Solution
There are 3 Steps involved in it
1 Expert Approved Answer
Step: 1 Unlock

Question Has Been Solved by an Expert!
Get step-by-step solutions from verified subject matter experts
Step: 2 Unlock
Step: 3 Unlock