

Question: K Following are two weekly forecasts made by two different methods for the number of gallons of gasoline, in thousands, demanded at a local gasoline
K Following are two weekly forecasts made by two different methods for the number of gallons of gasoline, in thousands, demanded at a local gasoline station. Also shown are actual demand levels, in thousands of gallons: Week 1 2 3 4 Forecast Method 1 The MAD for Method 1= 0.85 1.05 0.97 1.22 Actual Demand 0.70 1.05 1.07 0.97 Week 1 2 3 4 Forecast Method 2 Question Viewer 0.77 1.20 0.90 1.15 thousand gallons (round your response to three decimal places). Actual Demand 0.70 1.05 1.07 0.97
I NEED METHOD 1 and 2 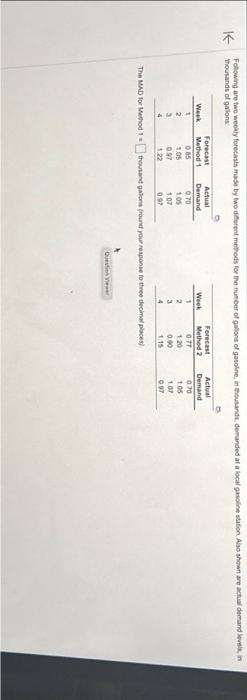
thousands of galons: \begin{tabular}{ccc} & & \\ Week & ForecastNethod1 & ActualDemand \\ \hline 1 & 0.55 & 070 \\ 2 & 1.05 & 1.05 \\ 3 & 0.97 & 1.07 \\ 4 & 1.22 & 0.97 \\ \hline \end{tabular} \begin{tabular}{ccc} Week & FerecastMethed2 & ActualDemand \\ \hline 1 & 077 & 070 \\ 2 & 120 & 105 \\ 3 & 090 & 1.09 \\ 4 & 115 & 0.97 \\ \hline \end{tabular}
Step by Step Solution
There are 3 Steps involved in it
1 Expert Approved Answer
Step: 1 Unlock

Question Has Been Solved by an Expert!
Get step-by-step solutions from verified subject matter experts
Step: 2 Unlock
Step: 3 Unlock