

Question: KEE E KE 1 2 3 4 5 The above 5 graphs represent different cost behavior. The vertical axis represents the costs and horizontal
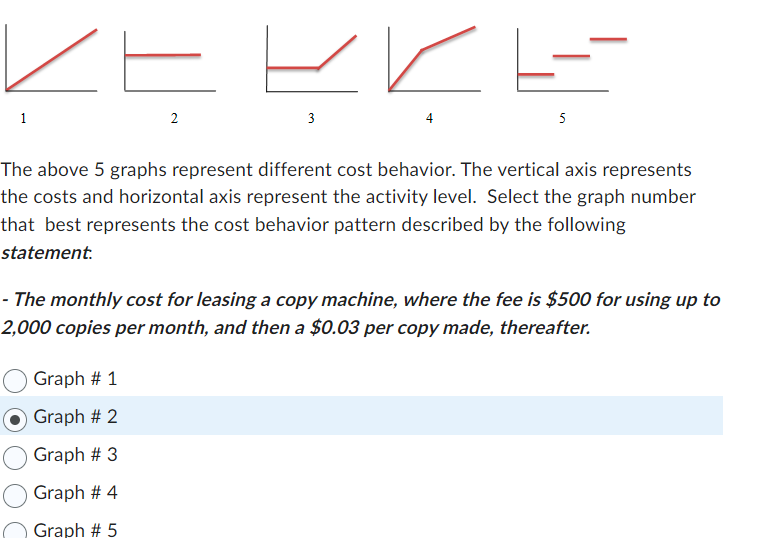
KEE E KE 1 2 3 4 5 The above 5 graphs represent different cost behavior. The vertical axis represents the costs and horizontal axis represent the activity level. Select the graph number that best represents the cost behavior pattern described by the following statement. - The monthly cost for leasing a copy machine, where the fee is $500 for using up to 2,000 copies per month, and then a $0.03 per copy made, thereafter. Graph #1 Graph #2 Graph #3 Graph #4 Graph #5
Step by Step Solution
There are 3 Steps involved in it
1 Expert Approved Answer
Step: 1 Unlock

Question Has Been Solved by an Expert!
Get step-by-step solutions from verified subject matter experts
Step: 2 Unlock
Step: 3 Unlock