

Question: Key comparative figures for Apple and Google follow. Required 1. Compute the amount of gross margin and the gross margin ratio for the two years
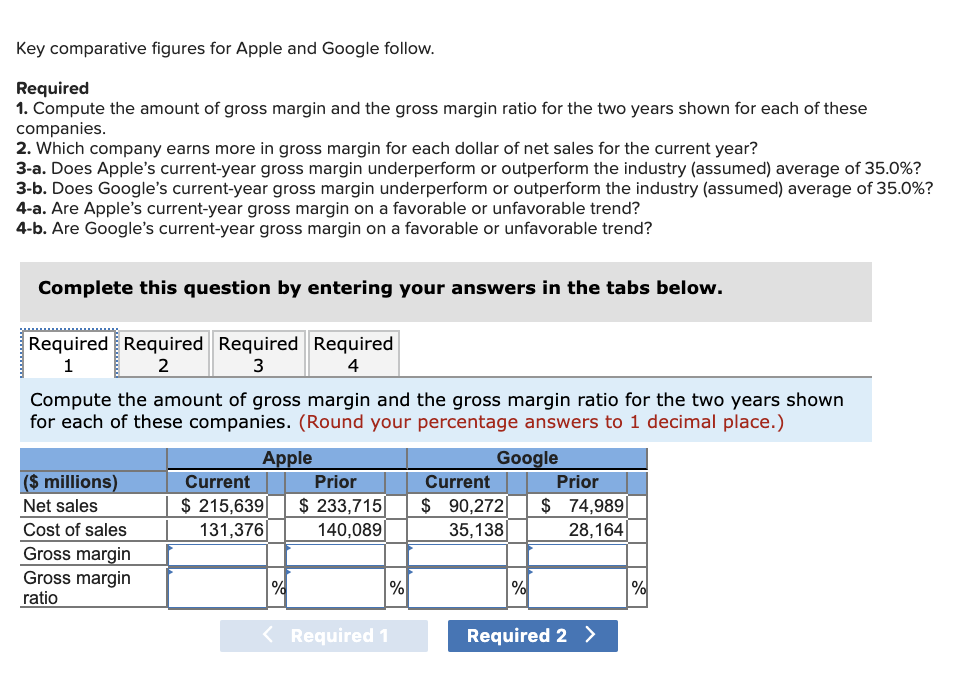
Key comparative figures for Apple and Google follow. Required 1. Compute the amount of gross margin and the gross margin ratio for the two years shown for each of these companies. 2. Which company earns more in gross margin for each dollar of net sales for the current year? 3-a. Does Apple's current-year gross margin underperform or outperform the industry (assumed) average of 35.0%? 3-b. Does Google's current-year gross margin underperform or outperform the industry (assumed) average of 35.0%? 4-a. Are Apple's current-year gross margin on a favorable or unfavorable trend? 4-b. Are Google's current-year gross margin on a favorable or unfavorable trend? Complete this question by entering your answers in the tabs below. Required Required Required Required 1 2 | 3 | 4 Compute the amount of gross margin and the gross margin ratio for the two years shown for each of these companies. (Round your percentage answers to 1 decimal place.) Apple Current Prior $ 215,639 | $ 233,715 131,376 140,089 Google Current Prior $ 90,272 $ 74,989 3 5.138 28,164 ($ millions) Net sales Cost of sales Gross margin Gross margin ratio Required 1 Required 2 >
Step by Step Solution
There are 3 Steps involved in it

Get step-by-step solutions from verified subject matter experts