

Question: Key figures for Apple and Google follow. $ millions Cash and equivalents. Accounts receivable, net. Apple $ 20,289 Google $ 10,715 18,336 17,874 4,855
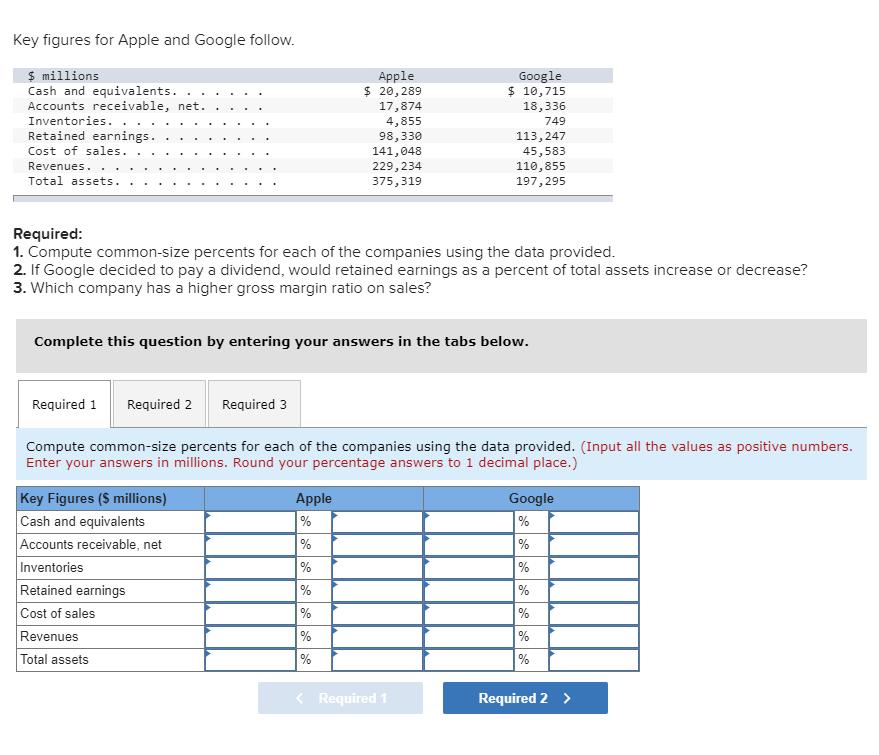
Key figures for Apple and Google follow. $ millions Cash and equivalents. Accounts receivable, net. Apple $ 20,289 Google $ 10,715 18,336 17,874 4,855 98,330 141,048 229,234 375,319 Inventories. 749 Retained earnings. Cost of sales. 113,247 45,583 110,855 197,295 Revenues. Total assets. Required: 1. Compute common-size percents for each of the companies using the data provided. 2. If Google decided to pay a dividend, would retained earnings as a percent of total assets increase or decrease? 3. Which company has a higher gross margin ratio on sales? Complete this question by entering your answers in the tabs below. Required 1 Required 2 Required 3 Compute common-size percents for each of the companies using the data provided. (Input all the values as positive numbers. Enter your answers in millions. Round your percentage answers to 1 decimal place.) Apple Key Figures (S millions) Cash and equivalents Accounts receivable, net Google % % % Inventories % % Retained earnings Cost of sales % % % % % % % % Revenues Total assets < Required 1 Required 2 >
Step by Step Solution
There are 3 Steps involved in it
Apple Google Key Figures millions Cash and equivalents 20289 5... View full answer

Get step-by-step solutions from verified subject matter experts