

Question: l he graph below shows the AD-AS diagram tor Braznl. Suppose that the economy is initially in long-run equilibrium with the price level of 700.

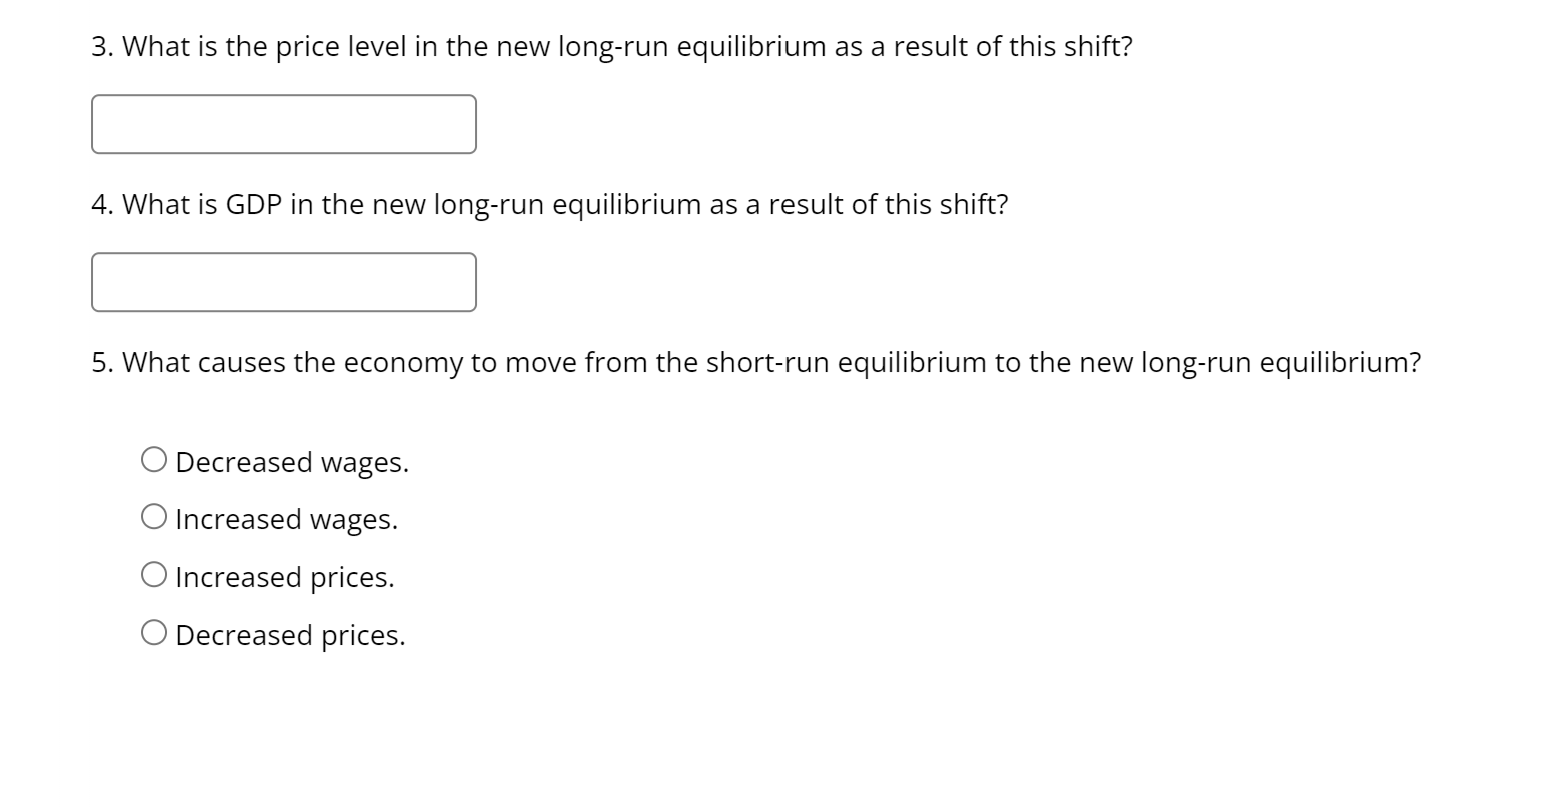


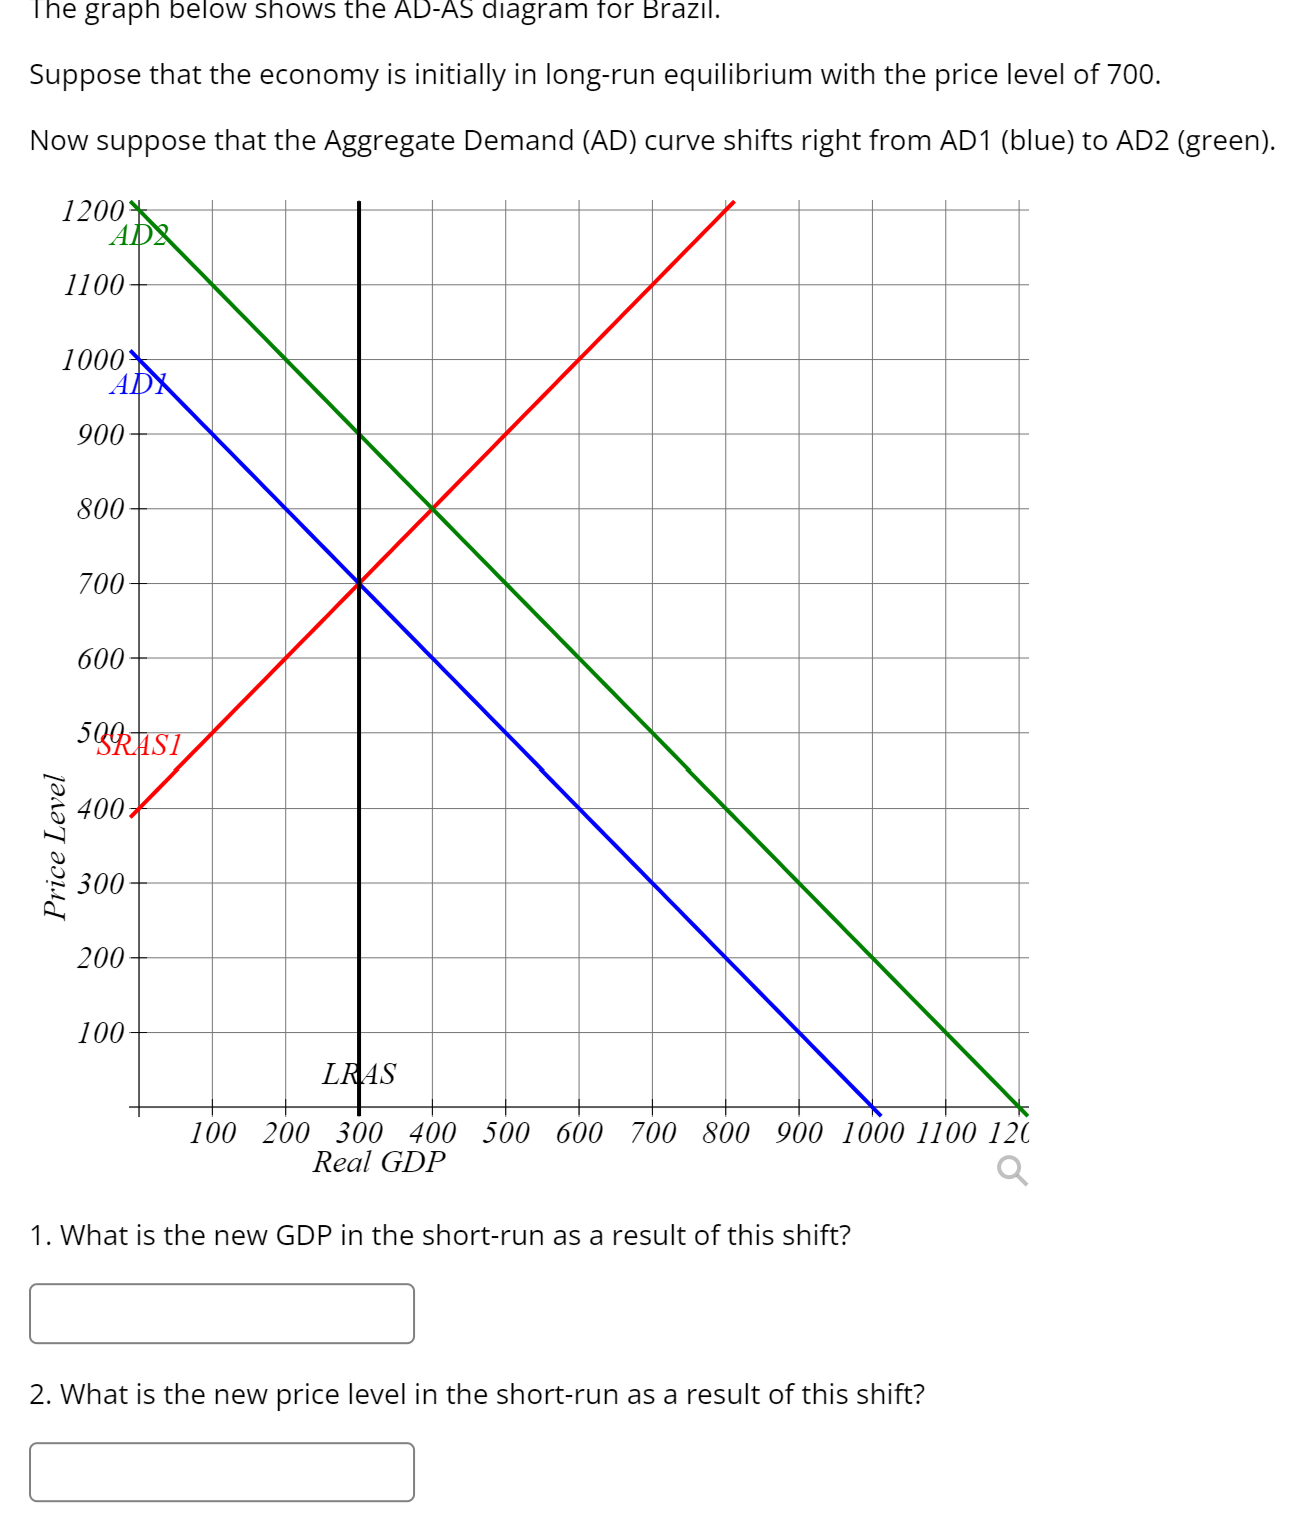

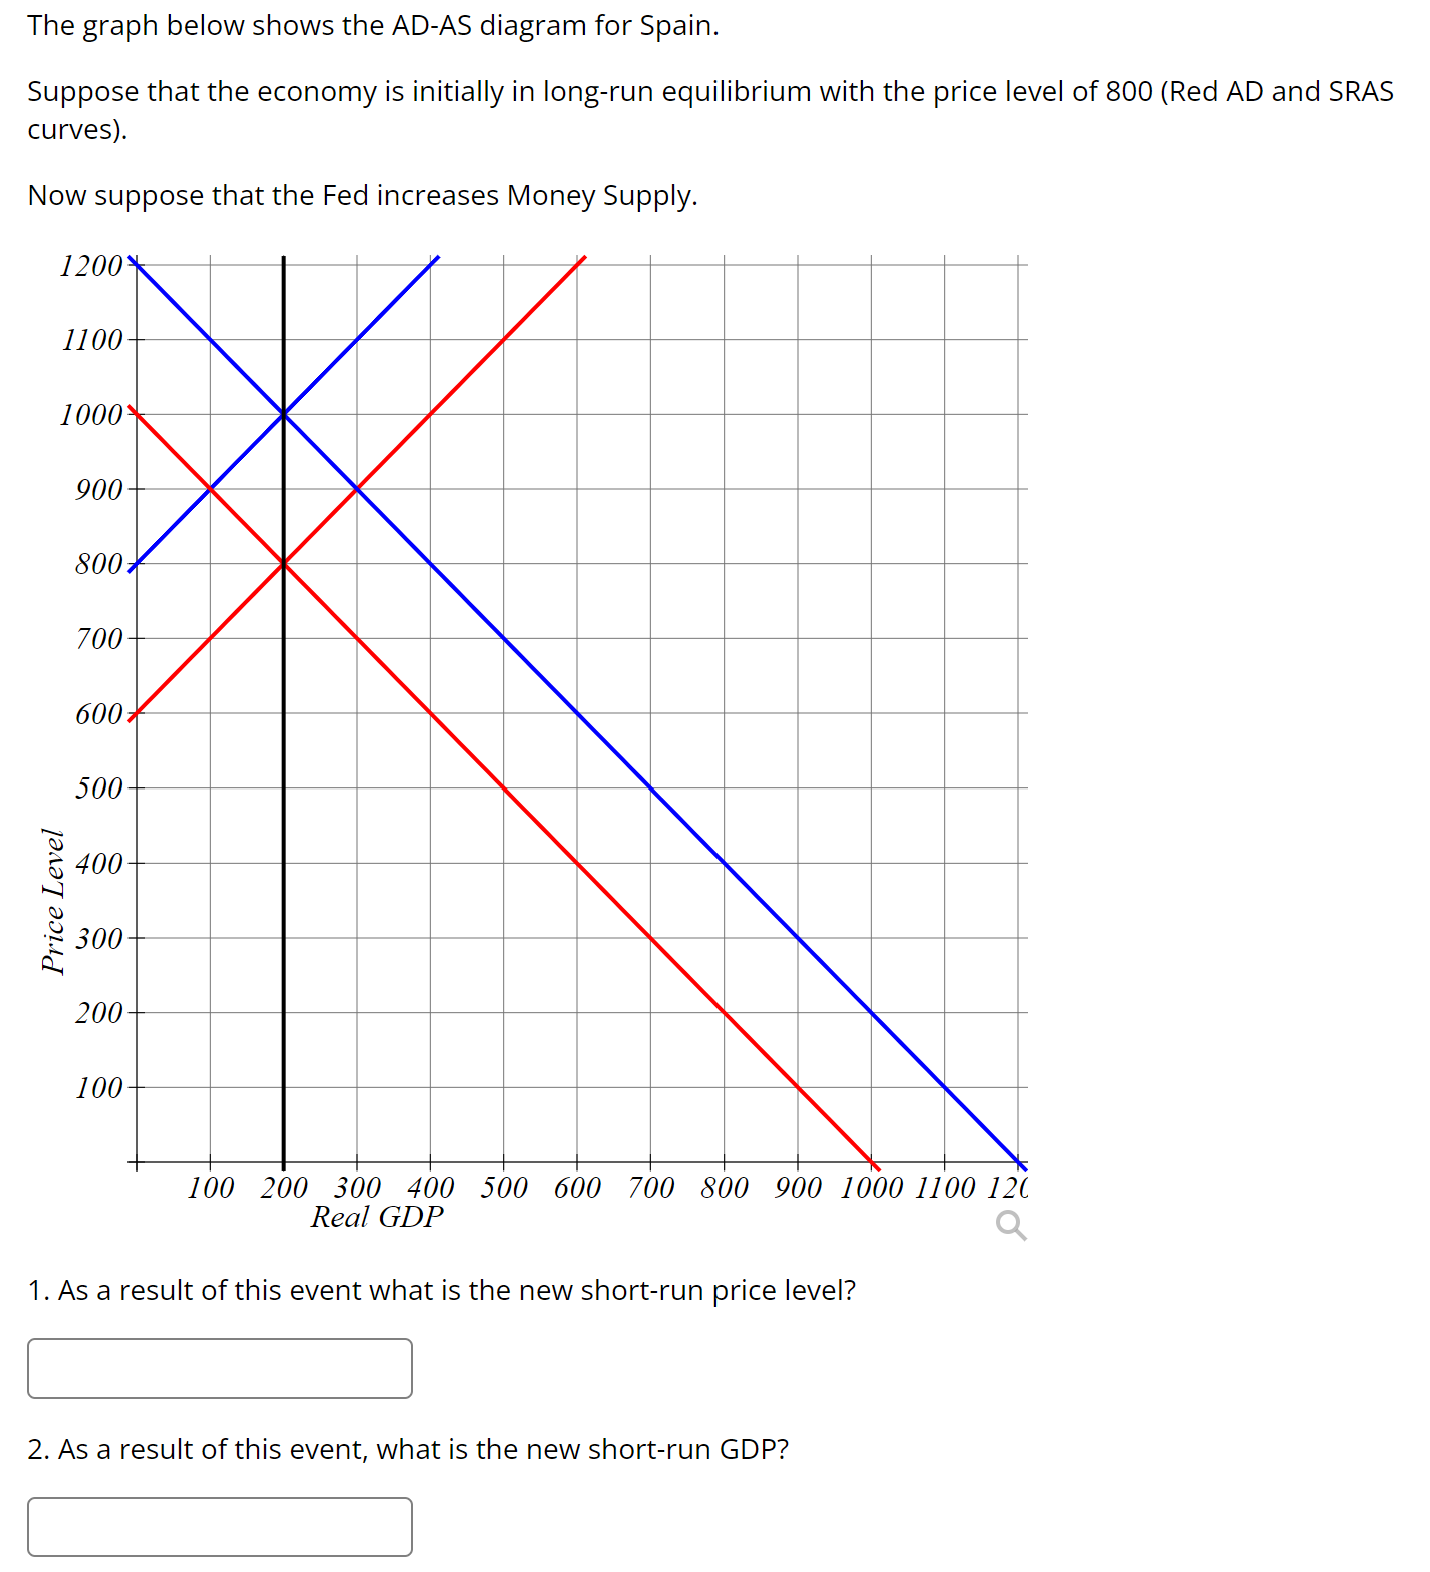

l he graph below shows the AD-AS diagram tor Braznl. Suppose that the economy is initially in long-run equilibrium with the price level of 700. Now suppose that the Aggregate Demand (AD) curve shifts right from ADl (blue) to AD2 (green). Price Level 200 100 100 200 300 400 500 600 700 800 900 1000110012C Real GDP 1. What is the new GDP in the short-run as a result of this shift? 2. What is the new price level in the short-run as a result of this shift? 3. What is the price level in the new long-run equilibrium as a result of this shift? 4. What is GDP in the new long-run equilibrium as a result of this shift? 5. What causes the economy to move from the short-run equilibrium to the new long-run equilibrium? 0 Decreased wages. 0 Increased wages. 0 Increased prices. O Decreased prices. The graph below shows the AD-AS diagram for Spain. Suppose that the economy is initially in long-run equilibrium with the price level of 800 (Red AD and SRAS curves) Now suppose that the Fed increases Money Supply. 700 6007 500 400 Price Level 300 200 100- 100 200 300 400 500 600 700 800 900 1000 1100 120 Real GDP Q 1. As a result of this event what is the new short-run price level? 2. As a result of this event, what is the new short-run GDP?3. As a result of this event, what is the new long-run price level? 4. As a result of this event, what is the new long-run GDP? Submit
Step by Step Solution
There are 3 Steps involved in it

Get step-by-step solutions from verified subject matter experts