Question: Lab 3 In-class Exercise: Excel Pivot Table Excel is a great tool with which to convert transaction information into analytical information. In this excel, we
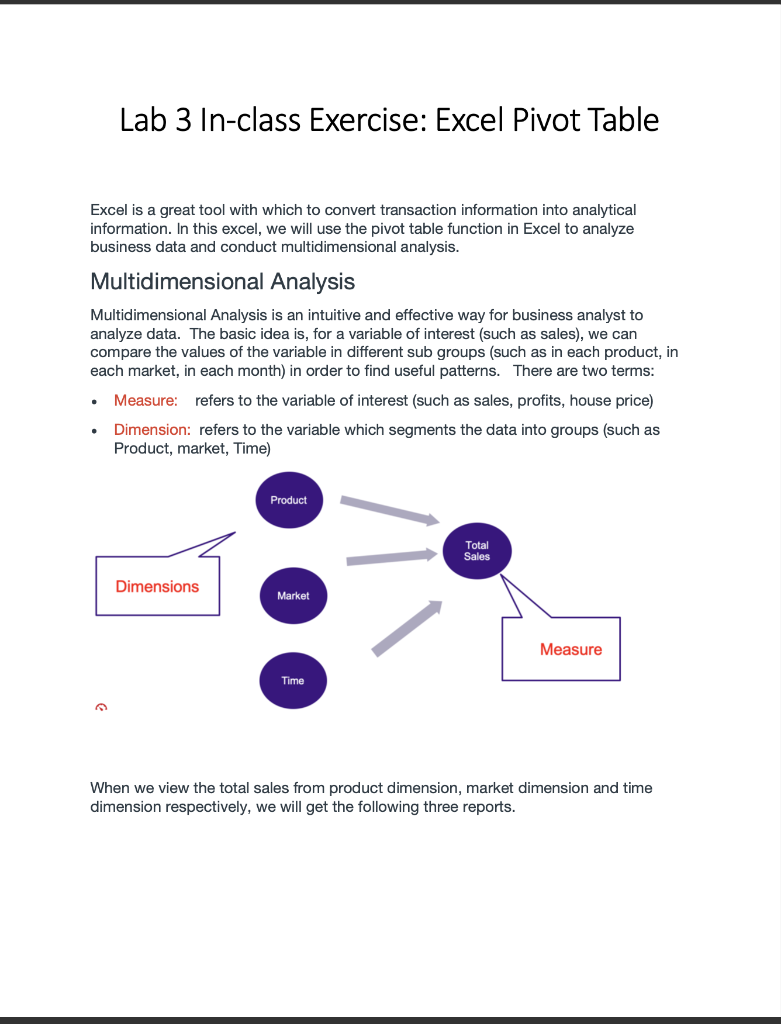
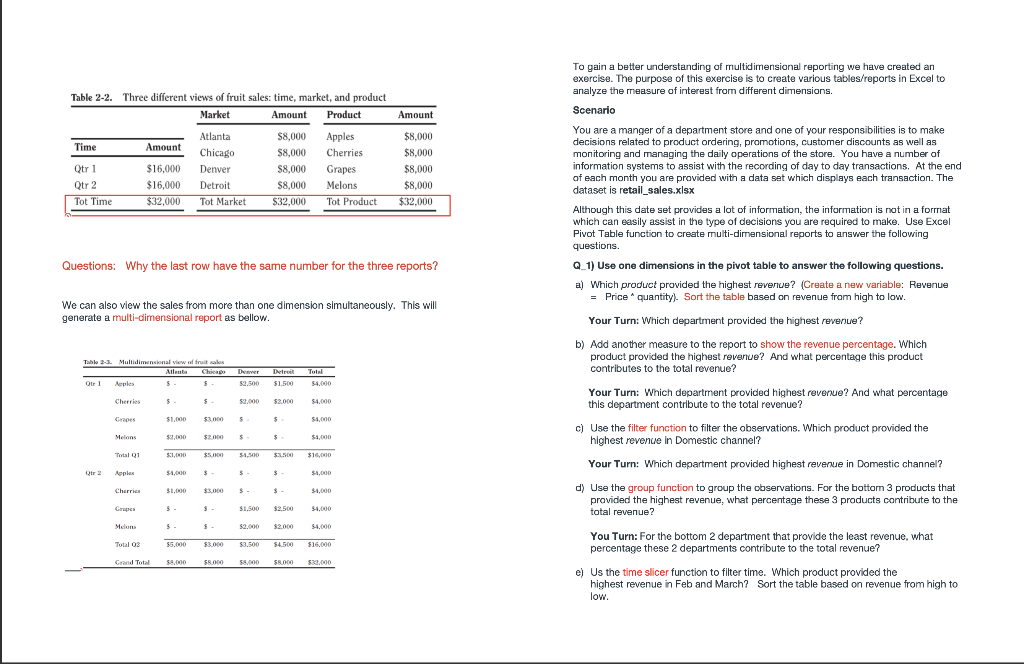
Lab 3 In-class Exercise: Excel Pivot Table Excel is a great tool with which to convert transaction information into analytical information. In this excel, we will use the pivot table function in Excel to analyze business data and conduct multidimensional analysis. Multidimensional Analysis Multidimensional Analysis is an intuitive and effective way for business analyst to analyze data. The basic idea is, for a variable of interest (such as sales), we can compare the values of the variable in different sub groups (such as in each product, in each market, in each month) in order to find useful patterns. There are two terms: Measure: refers to the variable of interest (such as sales, profits, house price) Dimension: refers to the variable which segments the data into groups (such as Product, market, Time) . . Product Total Sales Dimensions Market Measure Time When we view the total sales from product dimension, market dimension and time dimension respectively, we will get the following three reports. Amount Table 2-2. Three different views of fruit sales: time, market, and product Market Amount Product Atlanta $8,000 Apples Time Amount Chicago $8,000 Cherries Qtr 1 $16,000 Denver $8,000 Grapes Qtr 2 $16,000 Detroit Melons Tot Time $32,000 Tot Market $32,000 Tot Product $8,000 $8,000 $8.000 $8,000 $8.000 $32.000 $ To gain a better understanding of multidimensional reporting we have created an exercise. The purpose of this exercise is to create various tables/reports in Excel to analyze the measure of interest from different dimensions. Scenario You are a manger of a department store and one of your responsibilities is to make decisions related to product ordering, promotions, customer discounts as well as monitoring and managing the daily operations of the store. You have a number of information systems to assist with the recording of day to day transactions. At the end of each month you are provided with a data set which displays each transaction. The dataset is retail_sales.xlsx Although this date set provides a lot of information, the information is not in a format which can easily assist in the type of decisions you are required to make. Use Excel Pivot Table function to create multi-dimensional reports to answer the following questions. . Q.1) Use one dimensions in the pivot table to answer the following questions. a) Which product provided the highest revenue? (Create a new variable: Revenue = Price quantity). Sort the table based on revenue from high to low. Questions: Why the last row have the same number for the three reports? We can also view the sales from more than one dimension simultaneously. This will generate a multi-dimensional report as bellow. a -. Your Turn: Which department provided the highest revenue? b) Add another measure to the report to show the revenue percentage. Which product provided the highest revenue? And what percentage this product contributes to the total revenue? Tahle - Multidimensional works Atlanta Chicago Denvertir Qirl Aeples $ $1.500 Total $4,000 Cherries $ $2.000 $2.000 $4.000 Grapes $1.000 $3.000 $ $1.000 Your Turn: Which department provided highest revenue? And what percentage this department contribute to the total revenue? ? c) Use the filter function to filter the observations. Which product provided the highest revenue in Domestic channel? Melons $2.000 $2.000 5 $1.000 Total 01 SIMO $5.00 $1,500 $ $10,000 Your Turn: Which department provided highest revenue in Domestic channel? A PHA $1,000 $ $ $1,000 Cherries 31,000 33.000 $. $1,000 d) Use the group function to group the observations. For the bottom 3 products that provided the highest revenue, what percentage these 3 products contribute to the total revenue? Grupa $1.500 $2.500 $1,000 Mclum $2.000 $2.000 $4,000 Total 03 55.000 $3.000 $3.500 $4.000 $16.000 Grand Total $8.000 $8.000 You Turn: For the bottom 2 department that provide the least revenue, what percentage these 2 departments contribute to the total revenue? el Us the time slicer function to filter time. Which product provided the highest revenue in Feb and March? Sort the table based on revenue from high to low. Your Turn: Which department provided highest revenue in the first Quarter? Sort the table based on revenue from high to low. Q_2) Add multiple dimensions to the pivot table to answer the following questions. Which customer spent the most amount of money? What product did he or she spend the most money on? Sort the table based on revenue. Your Turn: Which salesperson provided the most sales revenue? Which customer bought the most from this salesperson? And which product this customer bought the most from this salesperson? Sort the table based on revenue. Q_3) Choose the right aggregate function of measure based on requirements. Use price as measure, show the average price and standard deviation for each product. Which product had the highest average price? Requirement: Submit a word document which contains the answers to the questions and the screenshots of pivot tables. Lab 3 In-class Exercise: Excel Pivot Table Excel is a great tool with which to convert transaction information into analytical information. In this excel, we will use the pivot table function in Excel to analyze business data and conduct multidimensional analysis. Multidimensional Analysis Multidimensional Analysis is an intuitive and effective way for business analyst to analyze data. The basic idea is, for a variable of interest (such as sales), we can compare the values of the variable in different sub groups (such as in each product, in each market, in each month) in order to find useful patterns. There are two terms: Measure: refers to the variable of interest (such as sales, profits, house price) Dimension: refers to the variable which segments the data into groups (such as Product, market, Time) . . Product Total Sales Dimensions Market Measure Time When we view the total sales from product dimension, market dimension and time dimension respectively, we will get the following three reports. Amount Table 2-2. Three different views of fruit sales: time, market, and product Market Amount Product Atlanta $8,000 Apples Time Amount Chicago $8,000 Cherries Qtr 1 $16,000 Denver $8,000 Grapes Qtr 2 $16,000 Detroit Melons Tot Time $32,000 Tot Market $32,000 Tot Product $8,000 $8,000 $8.000 $8,000 $8.000 $32.000 $ To gain a better understanding of multidimensional reporting we have created an exercise. The purpose of this exercise is to create various tables/reports in Excel to analyze the measure of interest from different dimensions. Scenario You are a manger of a department store and one of your responsibilities is to make decisions related to product ordering, promotions, customer discounts as well as monitoring and managing the daily operations of the store. You have a number of information systems to assist with the recording of day to day transactions. At the end of each month you are provided with a data set which displays each transaction. The dataset is retail_sales.xlsx Although this date set provides a lot of information, the information is not in a format which can easily assist in the type of decisions you are required to make. Use Excel Pivot Table function to create multi-dimensional reports to answer the following questions. . Q.1) Use one dimensions in the pivot table to answer the following questions. a) Which product provided the highest revenue? (Create a new variable: Revenue = Price quantity). Sort the table based on revenue from high to low. Questions: Why the last row have the same number for the three reports? We can also view the sales from more than one dimension simultaneously. This will generate a multi-dimensional report as bellow. a -. Your Turn: Which department provided the highest revenue? b) Add another measure to the report to show the revenue percentage. Which product provided the highest revenue? And what percentage this product contributes to the total revenue? Tahle - Multidimensional works Atlanta Chicago Denvertir Qirl Aeples $ $1.500 Total $4,000 Cherries $ $2.000 $2.000 $4.000 Grapes $1.000 $3.000 $ $1.000 Your Turn: Which department provided highest revenue? And what percentage this department contribute to the total revenue? ? c) Use the filter function to filter the observations. Which product provided the highest revenue in Domestic channel? Melons $2.000 $2.000 5 $1.000 Total 01 SIMO $5.00 $1,500 $ $10,000 Your Turn: Which department provided highest revenue in Domestic channel? A PHA $1,000 $ $ $1,000 Cherries 31,000 33.000 $. $1,000 d) Use the group function to group the observations. For the bottom 3 products that provided the highest revenue, what percentage these 3 products contribute to the total revenue? Grupa $1.500 $2.500 $1,000 Mclum $2.000 $2.000 $4,000 Total 03 55.000 $3.000 $3.500 $4.000 $16.000 Grand Total $8.000 $8.000 You Turn: For the bottom 2 department that provide the least revenue, what percentage these 2 departments contribute to the total revenue? el Us the time slicer function to filter time. Which product provided the highest revenue in Feb and March? Sort the table based on revenue from high to low. Your Turn: Which department provided highest revenue in the first Quarter? Sort the table based on revenue from high to low. Q_2) Add multiple dimensions to the pivot table to answer the following questions. Which customer spent the most amount of money? What product did he or she spend the most money on? Sort the table based on revenue. Your Turn: Which salesperson provided the most sales revenue? Which customer bought the most from this salesperson? And which product this customer bought the most from this salesperson? Sort the table based on revenue. Q_3) Choose the right aggregate function of measure based on requirements. Use price as measure, show the average price and standard deviation for each product. Which product had the highest average price? Requirement: Submit a word document which contains the answers to the questions and the screenshots of pivot tables


