

Question: Lab 3 Step 1: Forecasting Instructions and Data File At Using the data in the attached template, as a starting point: 1. Develop a 5
Lab 3 Step 1: Forecasting Instructions and Data File At 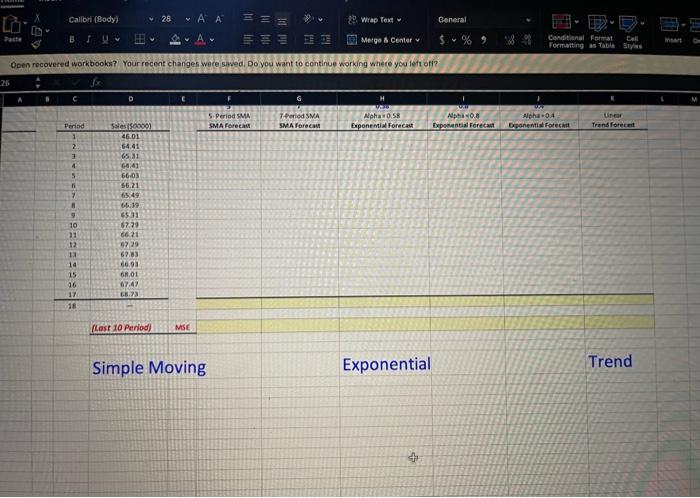
Simple Moving Exponential Trend
Using the data in the attached template, as a starting point:
1. Develop a 5 period simple moving average and 7 period simple moving average forecast through Period 18.
2. Develop a series of exponential forecasts through Period 18 with alpha of 0.40, 0.58, and 0.80.
3. Develop a linear trend forecast through Period 18 and then only Priod 21.
4. Compute the MS for each forecast based on the last 10 forecasts and determine the best forecasting method.
5. Also compute the MFE (Mean Forecast Error) and the MAE (Mean Absolute Error, a.k.a. Mean Absolute Deviation, MAD)
based on last 10 periods for the linear trend method.
6. Plot the results on a common graph on the second worksheet "Chart of Forecasts".* (Include plot of the original data as a
reference.)
a. Adjust the independent axis scale and starting point as necessary for clarity and observe "best practices" covered earlier.
>>Must be done or the chart will appear "cluttered" and difficult to read, w/o much separation between series.
b. "You may plot each one independently relative to the original data, but scale all the dependent axis to the same values for comparitive
purposes.
>>Must be done to avoid potentially misleading the audience if the axis scales differ. For the savy, it makes it easier to compare charts
C. Insert the #N/A symbol in leading blank cells (skipped cells) to instruct Excel to ignore those on the plot.
>> This avoids plotting zeros for empty cells and the leading line up to the first point.
Step by Step Solution
There are 3 Steps involved in it
1 Expert Approved Answer
Step: 1 Unlock

Question Has Been Solved by an Expert!
Get step-by-step solutions from verified subject matter experts
Step: 2 Unlock
Step: 3 Unlock