

Question: (LAST) (FIRST) HW #13, PART 1 A. Using the consumption function C = 60 + (9/10) Ya, complete the following table. All figures are in
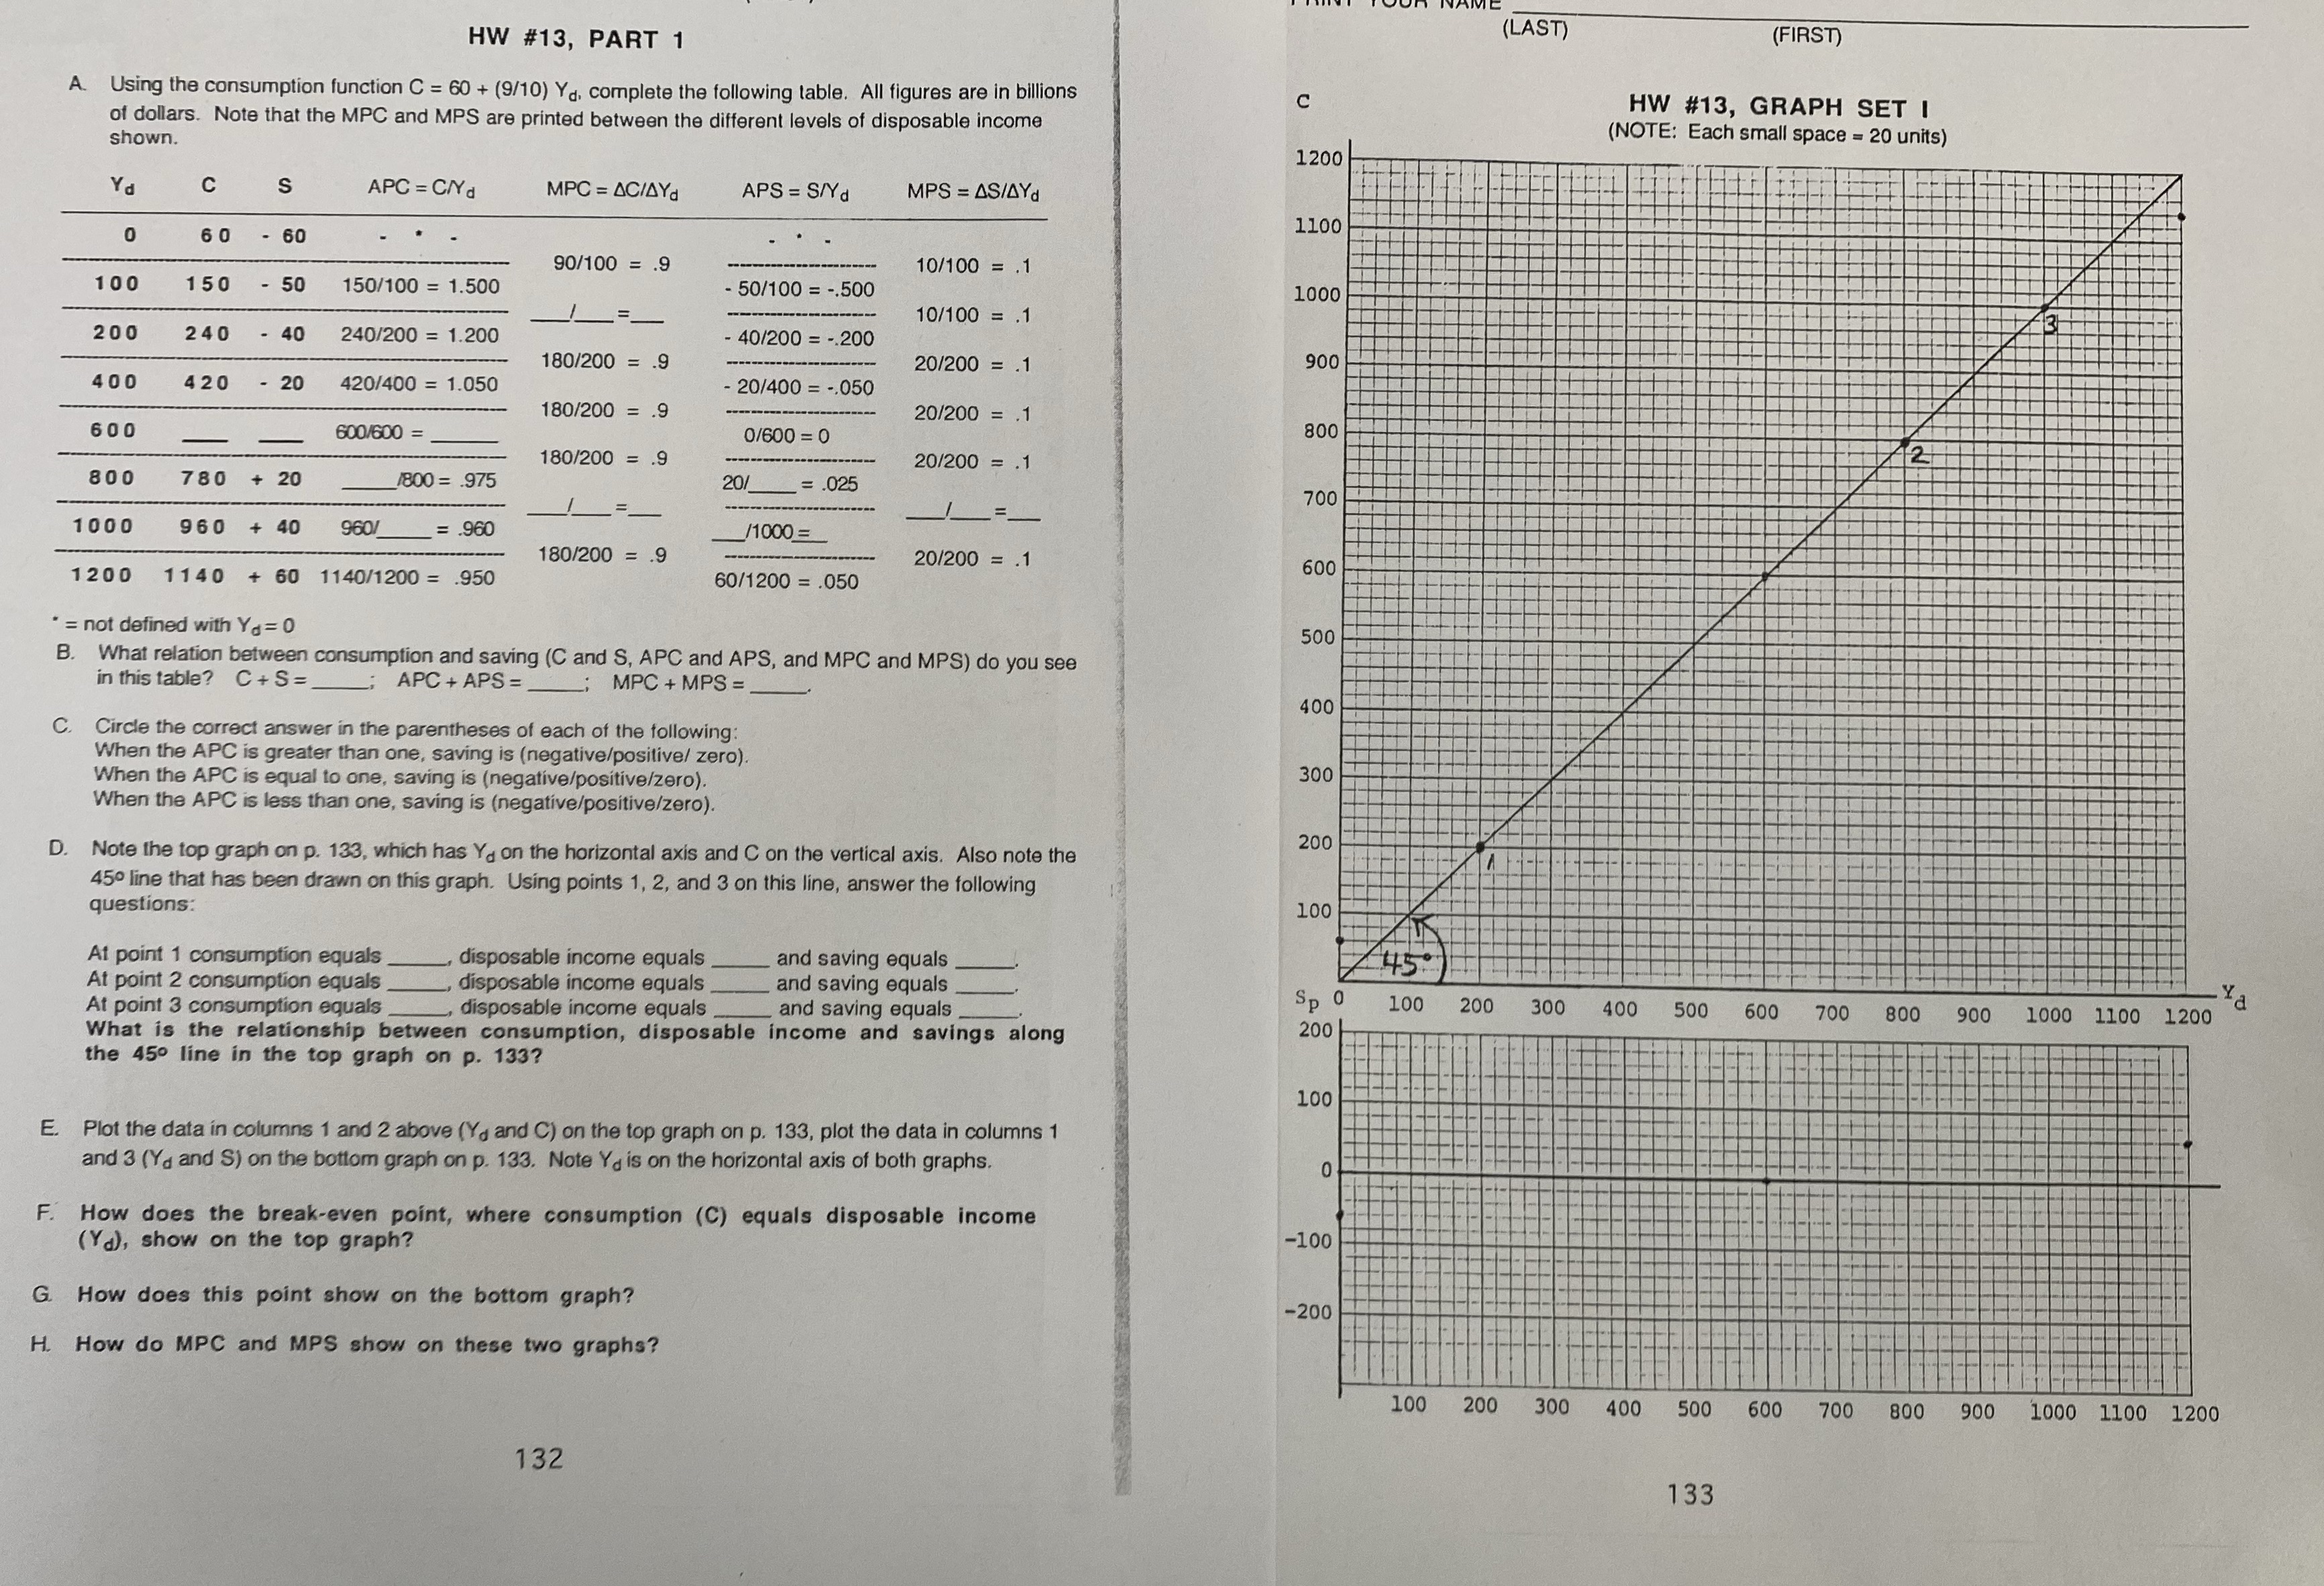

(LAST) (FIRST) HW #13, PART 1 A. Using the consumption function C = 60 + (9/10) Ya, complete the following table. All figures are in billions HW #13, GRAPH SET I of dollars. Note that the MPC and MPS are printed between the different levels of disposable income (NOTE: Each small space = 20 units) shown. 1200 Yd C S APC = CN d MPC = AC/AYd APS = S/Yd MPS = ASIAYd 1100 0 60 - 60 90/100 = .9 10/100 = .1 100 150 - 50 150/100 = 1.500 50/100 = -.500 1000 10/100 = .1 200 240 - 40 240/200 = 1.200 40/200 = -.200 180/200 = .9 20/200 = .1 900 400 420 - 20 420/400 = 1.050 20/400 = -.050 180/200 = .9 20/200 = .1 800 600 600/600 = 0/600 = 0 180/200 = .9 20/200 = .1 800 780 + 20 1800 = .975 20/ = .025 700 1000 960 + 40 960/ = .960 /1000 180/200 = .9 20/200 = .1 600 1200 1140 + 60 1140/1200 = .950 60/1200 = .050 * = not defined with Yd = 0 500 B. What relation between consumption and saving (C and S, APC and APS, and MPC and MPS) do you see in this table? C + S = APC + APS =_ MPC + MPS = 400 Circle the correct answer in the parentheses of each of the following When the APC is greater than one, saving is (negative/positive/ zero). 300 When the APC is equal to one, saving is (negative/positive/zero). When the APC is less than one, saving is (negative/positive/zero) 200 D. Note the top graph on p. 133, which has Y. on the horizontal axis and C on the vertical axis. Also note the 450 line that has been drawn on this graph. Using points 1, 2, and 3 on this line, answer the following questions: 100 At point 1 consumption equals disposable income equals. and saving equals 45 . At point 2 consumption equals disposable income equals and saving equals Sp 0 Ya At point 3 consumption equals disposable income equals and saving equals 100 200 300 400 500 600 700 800 900 1000 1100 1200 What is the relationship between consumption, disposable income and savings along 200 the 450 line in the top graph on p. 133? 100 Plot the data in columns 1 and 2 above (Y, and C) on the top graph on p. 133, plot the data in columns 1 and 3 (Ya and S) on the bottom graph on p. 133. Note Yd is on the horizontal axis of both graphs. 0 F. How does the break-even point, where consumption (C) equals disposable income -100 (Yd), show on the top graph? G. How does this point show on the bottom graph? -200 H. How do MPC and MPS show on these two graphs? 100 200 300 400 500 600 700 800 900 1000 1100 1200 132 133
Step by Step Solution
There are 3 Steps involved in it

Get step-by-step solutions from verified subject matter experts