

Question: Last, perform some sensitivity analysis using Goal Seek. For this question assume the you only have Favorable and Unfavorable markets and there is no Average
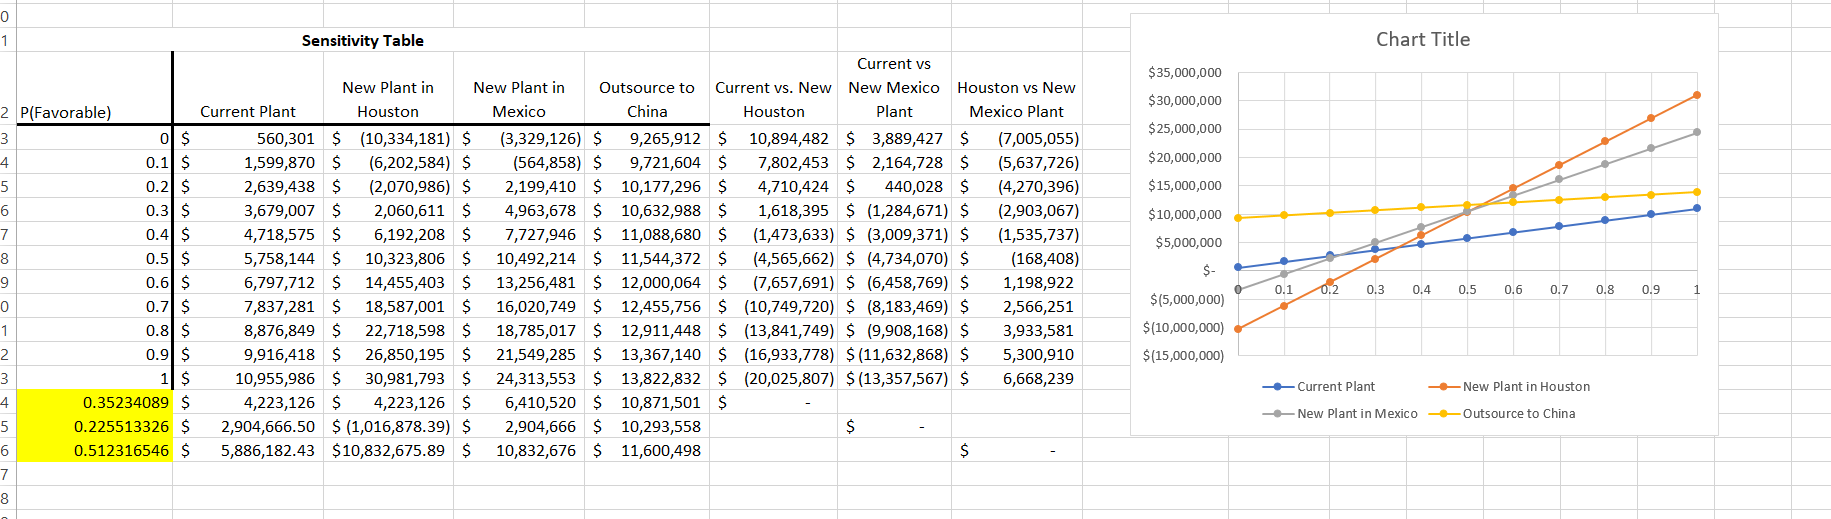
Last, perform some sensitivity analysis using Goal Seek. For this question assume the you only have Favorable and Unfavorable markets and there is no Average market possibility. Construct a sensitivity table and plot the payoffs versus P(Favorable). Then determine the trade-off points Current vs New Houston Plant, Current vs New NM plant, and Houston vs New Mexico plants. Comment on trade-off points.
Current vs new Houston .35
Current vs new Mexico .23
Houston vs Mexico .51
CoursHeroTranscribedText
0 1 2 P(Favorable) 3 4 5 6 7 8 9 0 1 2 3 4 5 6 7 8 0 $ 0.1 $ 0.2 $ 0.3 $ 0.4 $ 0.5 $ 0.6 $ 0.7 $ 0.8 $ 0.9 $ 1 $ 0.35234089 $ 0.225513326 $ 0.512316546 $ Sensitivity Table 560,301 $ 1,599,870 $ 2,639,438 $ 3,679,007 $ 4,718,575 $ 5,758,144 $ 6,797,712 $ 7,837,281 $ 8,876,849 $ 9,916,418 $ 10,955,986 $ 30,981,793 $ 4,223,126 $ 4,223,126 $ New Plant in Houston (10,334,181) $ (6,202,584) $ (2,070,986) $ 2,060,611 $ 6,192,208 $ 10,323,806 $ 14,455,403 $ 18,587,001 $ 22,718,598 $ 26,850,195 $ Current Plant 2,904,666.50 $ (1,016,878.39) $ 5,886,182.43 $10,832,675.89 $ Current vs Outsource to Current vs. New New Mexico China Houston Plant 9,265,912 $ 10,894,482 $ 3,889,427 $ 9,721,604 $ 7,802,453 $ 2,164,728 $ 10,177,296 $ 4,710,424 $ 440,028 $ 10,632,988 $ 1,618,395 $ (1,284,671) $ 11,088,680 $ (1,473,633) $ (3,009,371) $ 11,544,372 $ (4,565,662) $ (4,734,070) $ 12,000,064 $ (7,657,691) $ (6,458,769) $ 12,455,756 $ (10,749,720) $ (8,183,469) $ 12,911,448 $ (13,841,749) $ (9,908,168) $ 13,367,140 $ (16,933,778) $ (11,632,868) $ 13,822,832 $ (20,025,807) $ (13,357,567) $ 10,871,501 $ New Plant in Mexico (3,329,126) $ (564,858) $ 2,199,410 $ 4,963,678 $ 7,727,946 $ 10,492,214 $ 13,256,481 $ 16,020,749 $ 18,785,017 $ 21,549,285 $ 24,313,553 $ 6,410,520 $ 2,904,666 $ 10,293,558 10,832,676 $ 11,600,498 $ Houston vs New Mexico Plant $ (7,005,055) (5,637,726) (4,270,396) (2,903,067) (1,535,737) (168,408) 1,198,922 2,566,251 3,933,581 5,300,910 6,668,239 $35,000,000 $30,000,000 $25,000,000 $20,000,000 $15,000,000 $10,000,000 $5,000,000 $- $(5,000,000) $(10,000,000) $(15,000,000) 0.1 Chart Title 2 0.2 0.3 0.4 Current Plant - New Plant in Mexico 0.5 0.6 0.7 -New Plant in Houston --Outsource to China 0.8 0.9 1
Step by Step Solution
3.44 Rating (151 Votes )
There are 3 Steps involved in it
the sensitivity analysis using Goal Seek for the scenario with only Favorable and Unfavorable markets Sensitivity Table The sensitivity table shown in the image considers different probabilities PFavo... View full answer

Get step-by-step solutions from verified subject matter experts