

Question: Last time I posted was incorrect :( Im still having some trouble. Thank you! The comparative balance sheet of Livers Inc. for December 31, 20Y3


 Last time I posted was incorrect :( Im still having some trouble. Thank you!
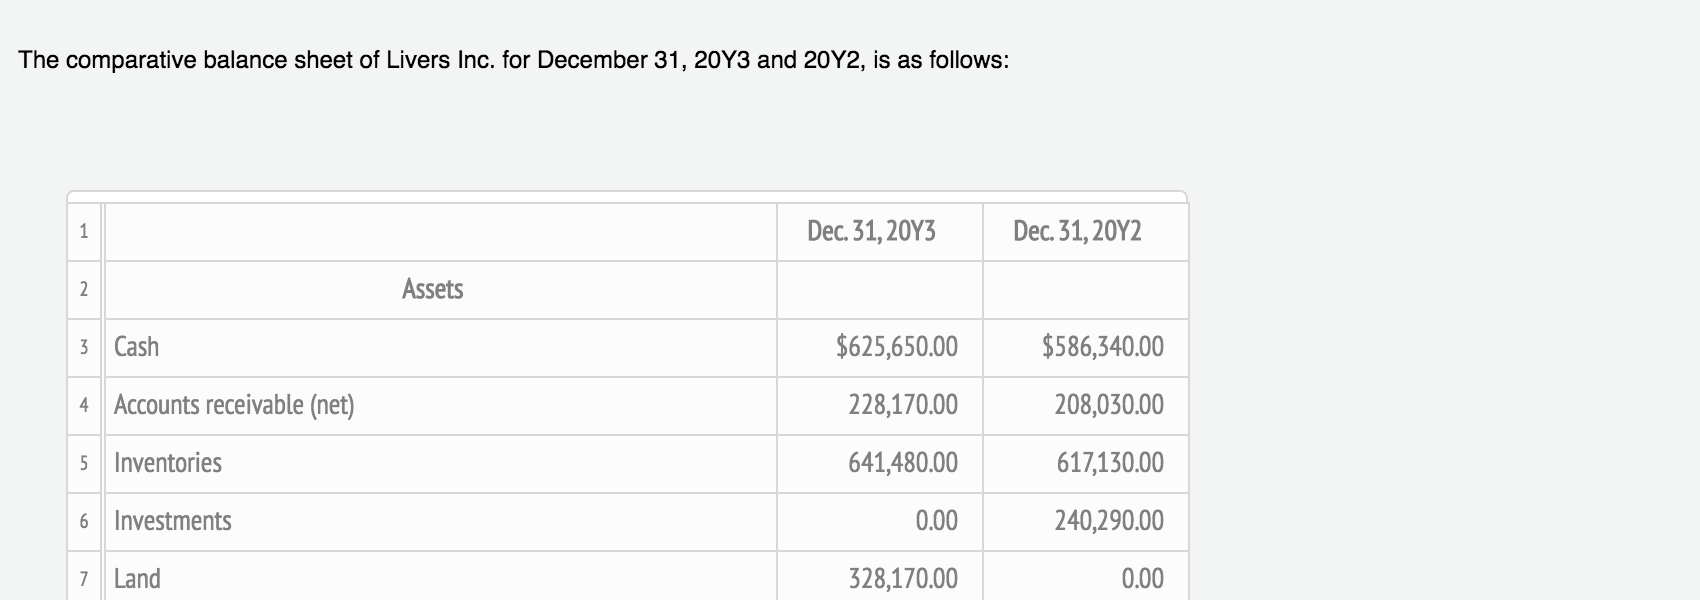
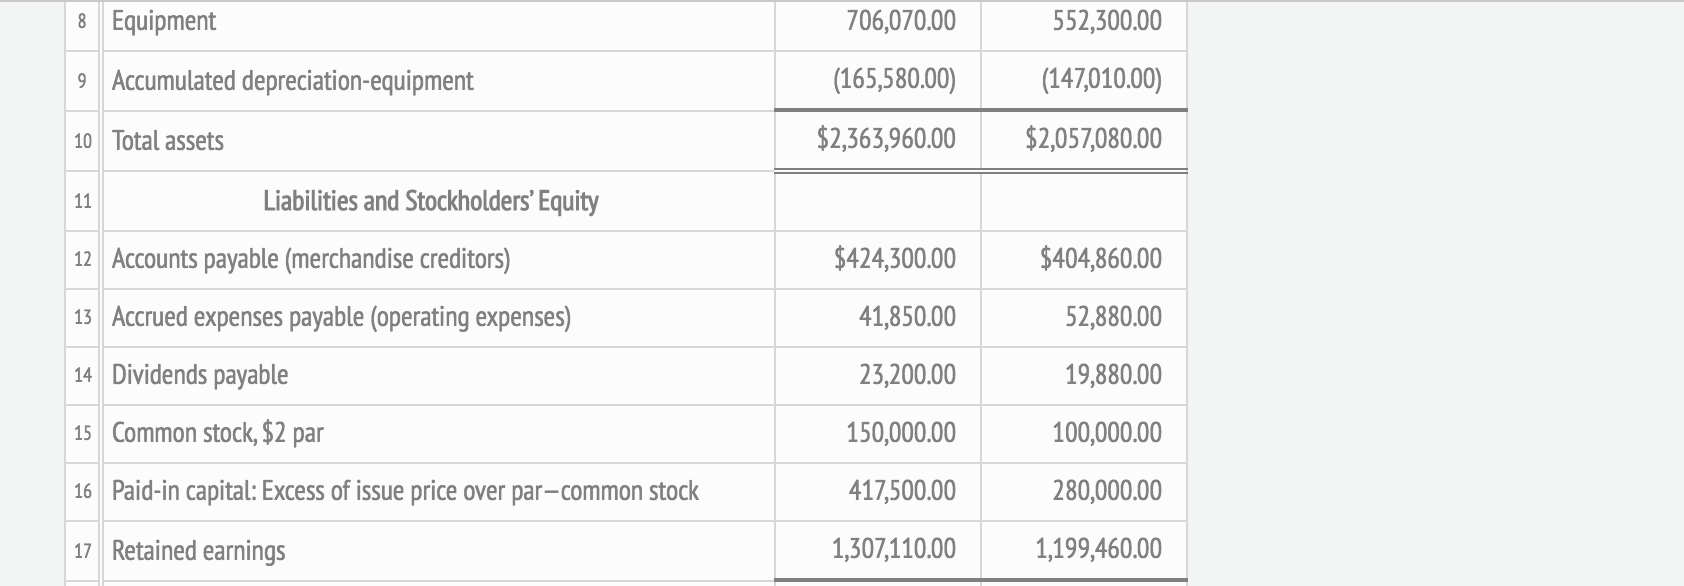
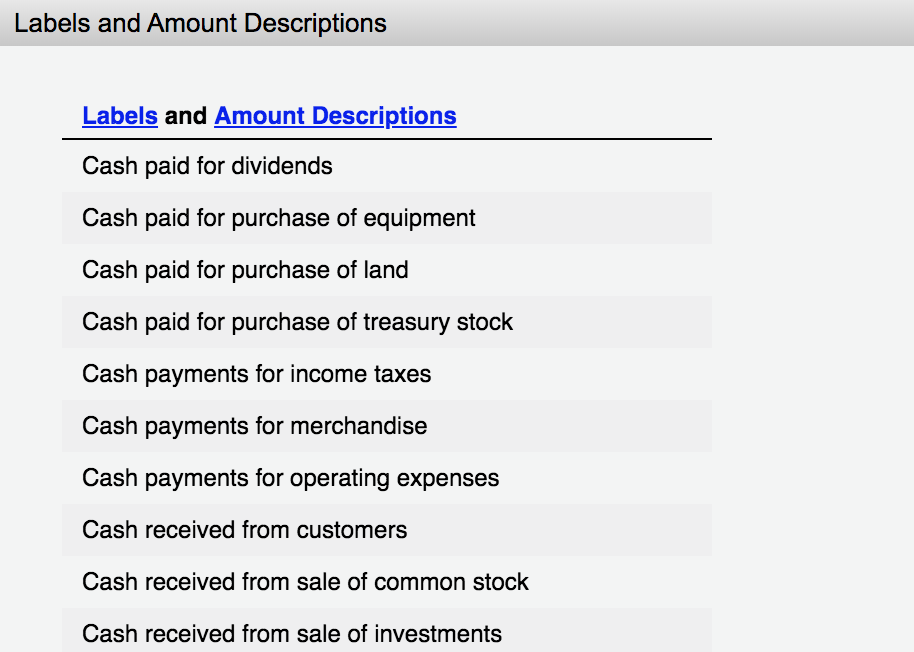
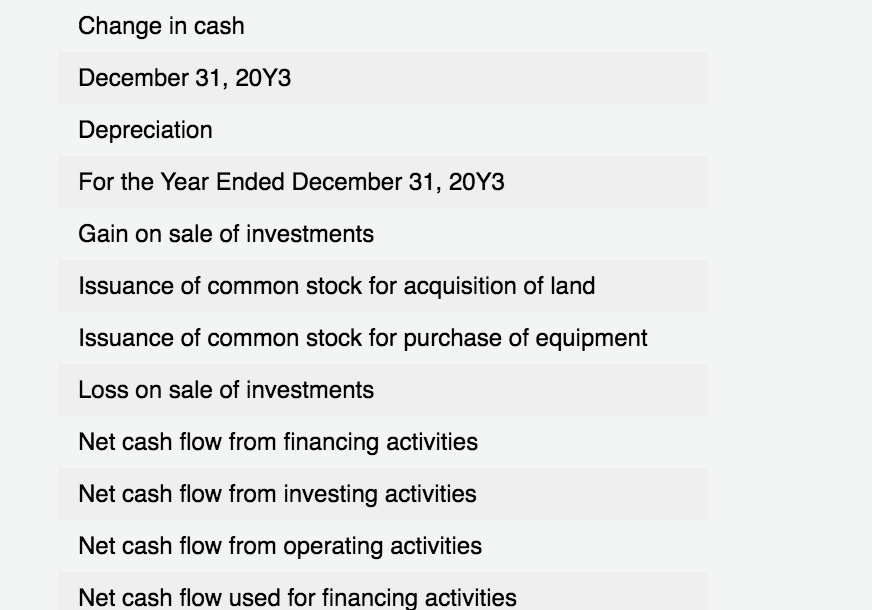
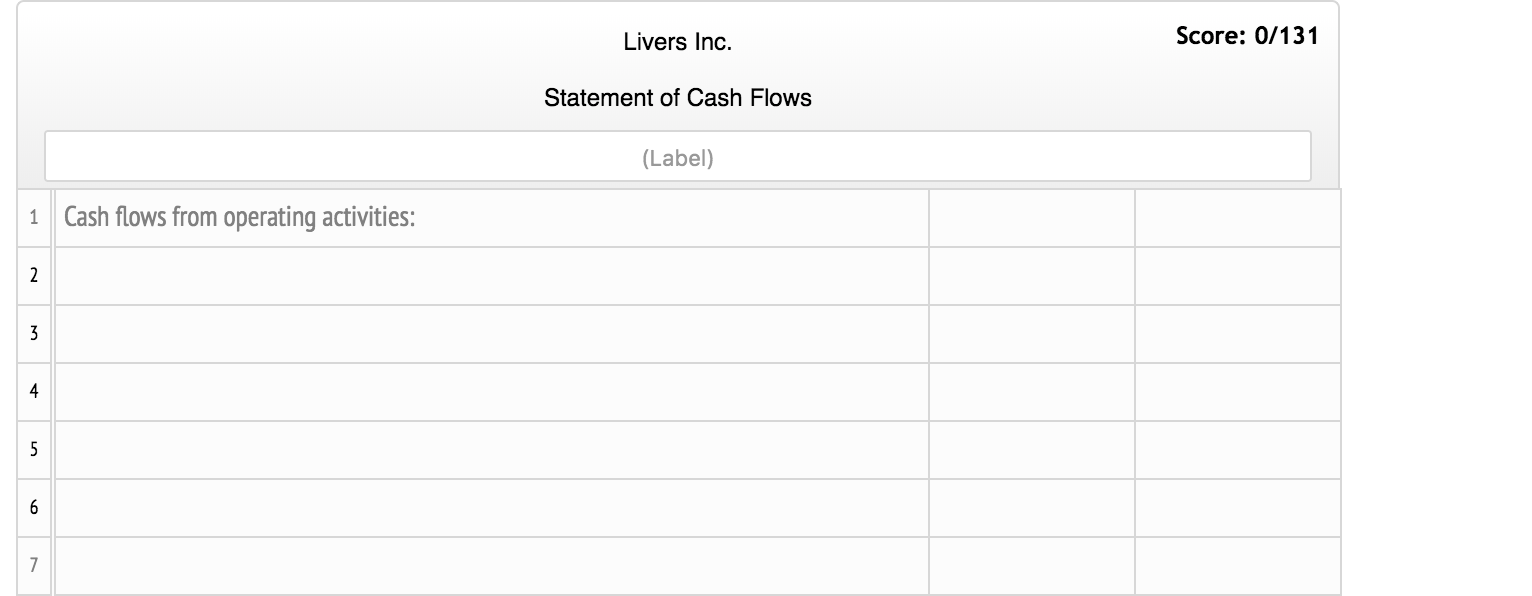
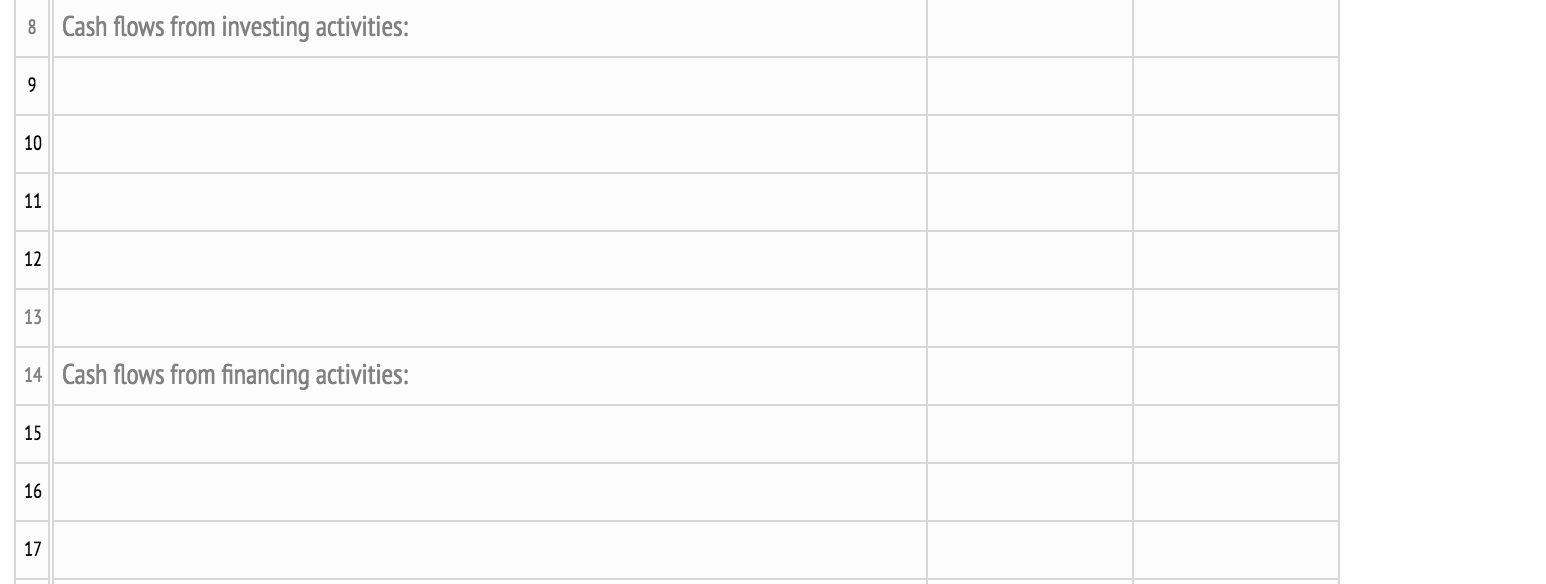
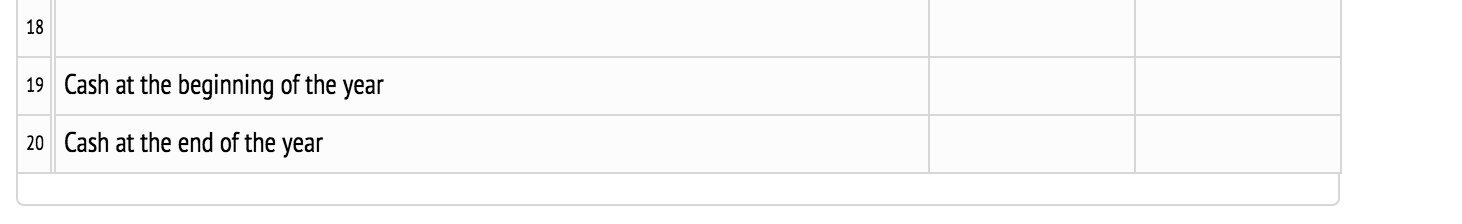
The comparative balance sheet of Livers Inc. for December 31, 20Y3 and 20Y2, is as follows: Dec. 31, 20Y3 Dec. 31, 20Y2 Assets Cash $625,650.00 $586,340.00 Accounts receivable (net) 228,170.00 208,030.00 Inventories 641,480.00 617,130.00 Investments 0.00 240,290.00 7 Land 328,170.00 0.00 8 Equipment 552,300.00 706,070.00 (165,580.00) 9 Accumulated depreciation-equipment (147,010.00) 10 Total assets $2,363,960.00 $2,057,080.00 $424,300.00 Liabilities and Stockholders' Equity 12 Accounts payable (merchandise creditors) 13 Accrued expenses payable (operating expenses) 14 Dividends payable $404,860.00 52,880.00 41,850.00 19,880.00 23,200.00 150,000.00 15 Common stock, $2 par 100,000.00 16 Paid-in capital: Excess of issue price over par-common stock 417,500.00 280,000.00 17 Retained earnings 1,307,110.00 1,199,460.00 18 Total liabilities and stockholders' equity $2,363,960.00 $2,057,080.00 Labels and Amount Descriptions Labels and Amount Descriptions Cash paid for dividends Cash paid for purchase of equipment Cash paid for purchase of land Cash paid for purchase of treasury stock Cash payments for income taxes Cash payments for merchandise Cash payments for operating expenses Cash received from customers Cash received from sale of common stock Cash received from sale of investments Change in cash December 31, 20Y3 Depreciation For the Year Ended December 31, 20Y3 Gain on sale of investments Issuance of common stock for acquisition of land Issuance of common stock for purchase of equipment Loss on sale of investments Net cash flow from financing activities Net cash flow from investing activities Net cash flow from operating activities Net cash flow used for financing activities Net cash flow used for investing activities Net cash flow used for operating activities Livers Inc. Score: 0/131 Statement of Cash Flows (Label) 1 Cash flows from operating activities: 8 Cash flows from investing activities: 14 Cash flows from financing activities: 19 Cash at the beginning of the year 20 Cash at the end of the year The comparative balance sheet of Livers Inc. for December 31, 20Y3 and 20Y2, is as follows: Dec. 31, 20Y3 Dec. 31, 20Y2 Assets Cash $625,650.00 $586,340.00 Accounts receivable (net) 228,170.00 208,030.00 Inventories 641,480.00 617,130.00 Investments 0.00 240,290.00 7 Land 328,170.00 0.00 8 Equipment 552,300.00 706,070.00 (165,580.00) 9 Accumulated depreciation-equipment (147,010.00) 10 Total assets $2,363,960.00 $2,057,080.00 $424,300.00 Liabilities and Stockholders' Equity 12 Accounts payable (merchandise creditors) 13 Accrued expenses payable (operating expenses) 14 Dividends payable $404,860.00 52,880.00 41,850.00 19,880.00 23,200.00 150,000.00 15 Common stock, $2 par 100,000.00 16 Paid-in capital: Excess of issue price over par-common stock 417,500.00 280,000.00 17 Retained earnings 1,307,110.00 1,199,460.00 18 Total liabilities and stockholders' equity $2,363,960.00 $2,057,080.00 Labels and Amount Descriptions Labels and Amount Descriptions Cash paid for dividends Cash paid for purchase of equipment Cash paid for purchase of land Cash paid for purchase of treasury stock Cash payments for income taxes Cash payments for merchandise Cash payments for operating expenses Cash received from customers Cash received from sale of common stock Cash received from sale of investments Change in cash December 31, 20Y3 Depreciation For the Year Ended December 31, 20Y3 Gain on sale of investments Issuance of common stock for acquisition of land Issuance of common stock for purchase of equipment Loss on sale of investments Net cash flow from financing activities Net cash flow from investing activities Net cash flow from operating activities Net cash flow used for financing activities Net cash flow used for investing activities Net cash flow used for operating activities Livers Inc. Score: 0/131 Statement of Cash Flows (Label) 1 Cash flows from operating activities: 8 Cash flows from investing activities: 14 Cash flows from financing activities: 19 Cash at the beginning of the year 20 Cash at the end of the year
Step by Step Solution
There are 3 Steps involved in it

Get step-by-step solutions from verified subject matter experts