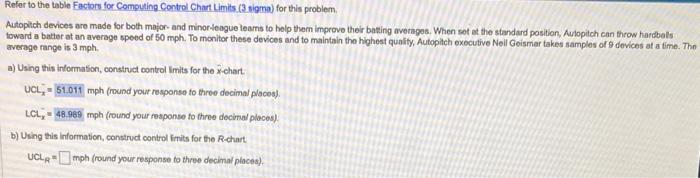
Question: LCL also please begin{tabular}{cccc} hline Sample Size, n & Mean Factor, & Upper Range, & Lower Range, hline 2 & A2 & D4 &

LCL also please LCL also please \begin{tabular}{cccc} \hline
LCL also please \begin{tabular}{cccc} \hline
\begin{tabular}{cccc} \hline Sample Size, n & Mean Factor, & Upper Range, & Lower Range, \\ \hline 2 & A2 & D4 & D3 \\ \hline 3 & 1.880 & 3.268 & 0 \\ 4 & 1.023 & 2.574 & 0 \\ 5 & 0.729 & 2.282 & 0 \\ 6 & 0.577 & 2.115 & 0 \\ 7 & 0.483 & 2.004 & 0 \\ 8 & 0.419 & 1.924 & 0.076 \\ 9 & 0.373 & 1.864 & 0.136 \\ 10 & 0.337 & 1.816 & 0.184 \\ 12 & 0.308 & 1.777 & 0.223 \\ & 0.266 & 1.716 & 0.284 \\ \hline \end{tabular} Autopitch devices are made for both major-and minorteague teams to holp them improvo their bating averagos. When sot at the standard position, Aulopitch can throw hardbals toward a batter at an average speed of 50mph. To monitor these devices and to maintain the highest quality, Autopitch exocutive Neil Geismar takes samples of 9 devices at a time. Thn averege range is 3mph. a) Using this information, construct control Imits for the x-chart. UCLx=51.011 mph (round yout response to throe decimal placos). LClx=48.989mph (round your response to three decimal places): b) Using this information, construct control inits for the R-chart? UCLR= mph (round your response to three decimal places)

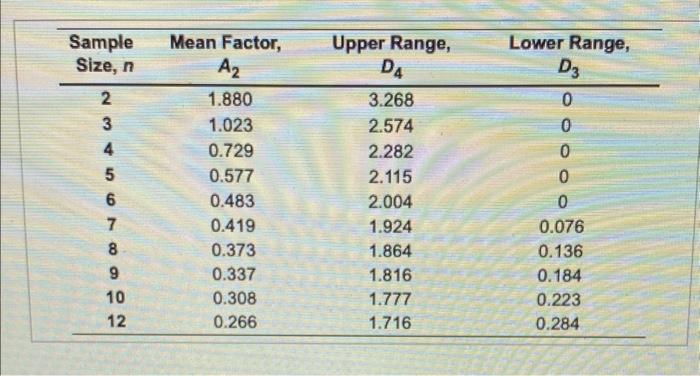
Step by Step Solution

There are 3 Steps involved in it

1 Expert Approved Answer
Step: 1 Unlock blur-text-image
Question Has Been Solved by an Expert!

Get step-by-step solutions from verified subject matter experts

Step: 2 Unlock
Step: 3 Unlock

Students Have Also Explored These Related General Management Questions!