

Question: Lead a Data Talk and reflect on the Data Talk. What did/didn't go the way you planned? The reflection s h o u l d
Lead a Data Talk and reflect on the Data Talk. What did/didn't go the way you planned?
The reflection s h o u l d be one to 2 para graphs.
--------------------------------------------------------------------------------------------------------------------------------------
State the group of people in which y o u will lead the Data Talk. They can be your family, friends, co-workers, etc.
What do you notice?
What do you wonder?
What is going on in this data visualization?
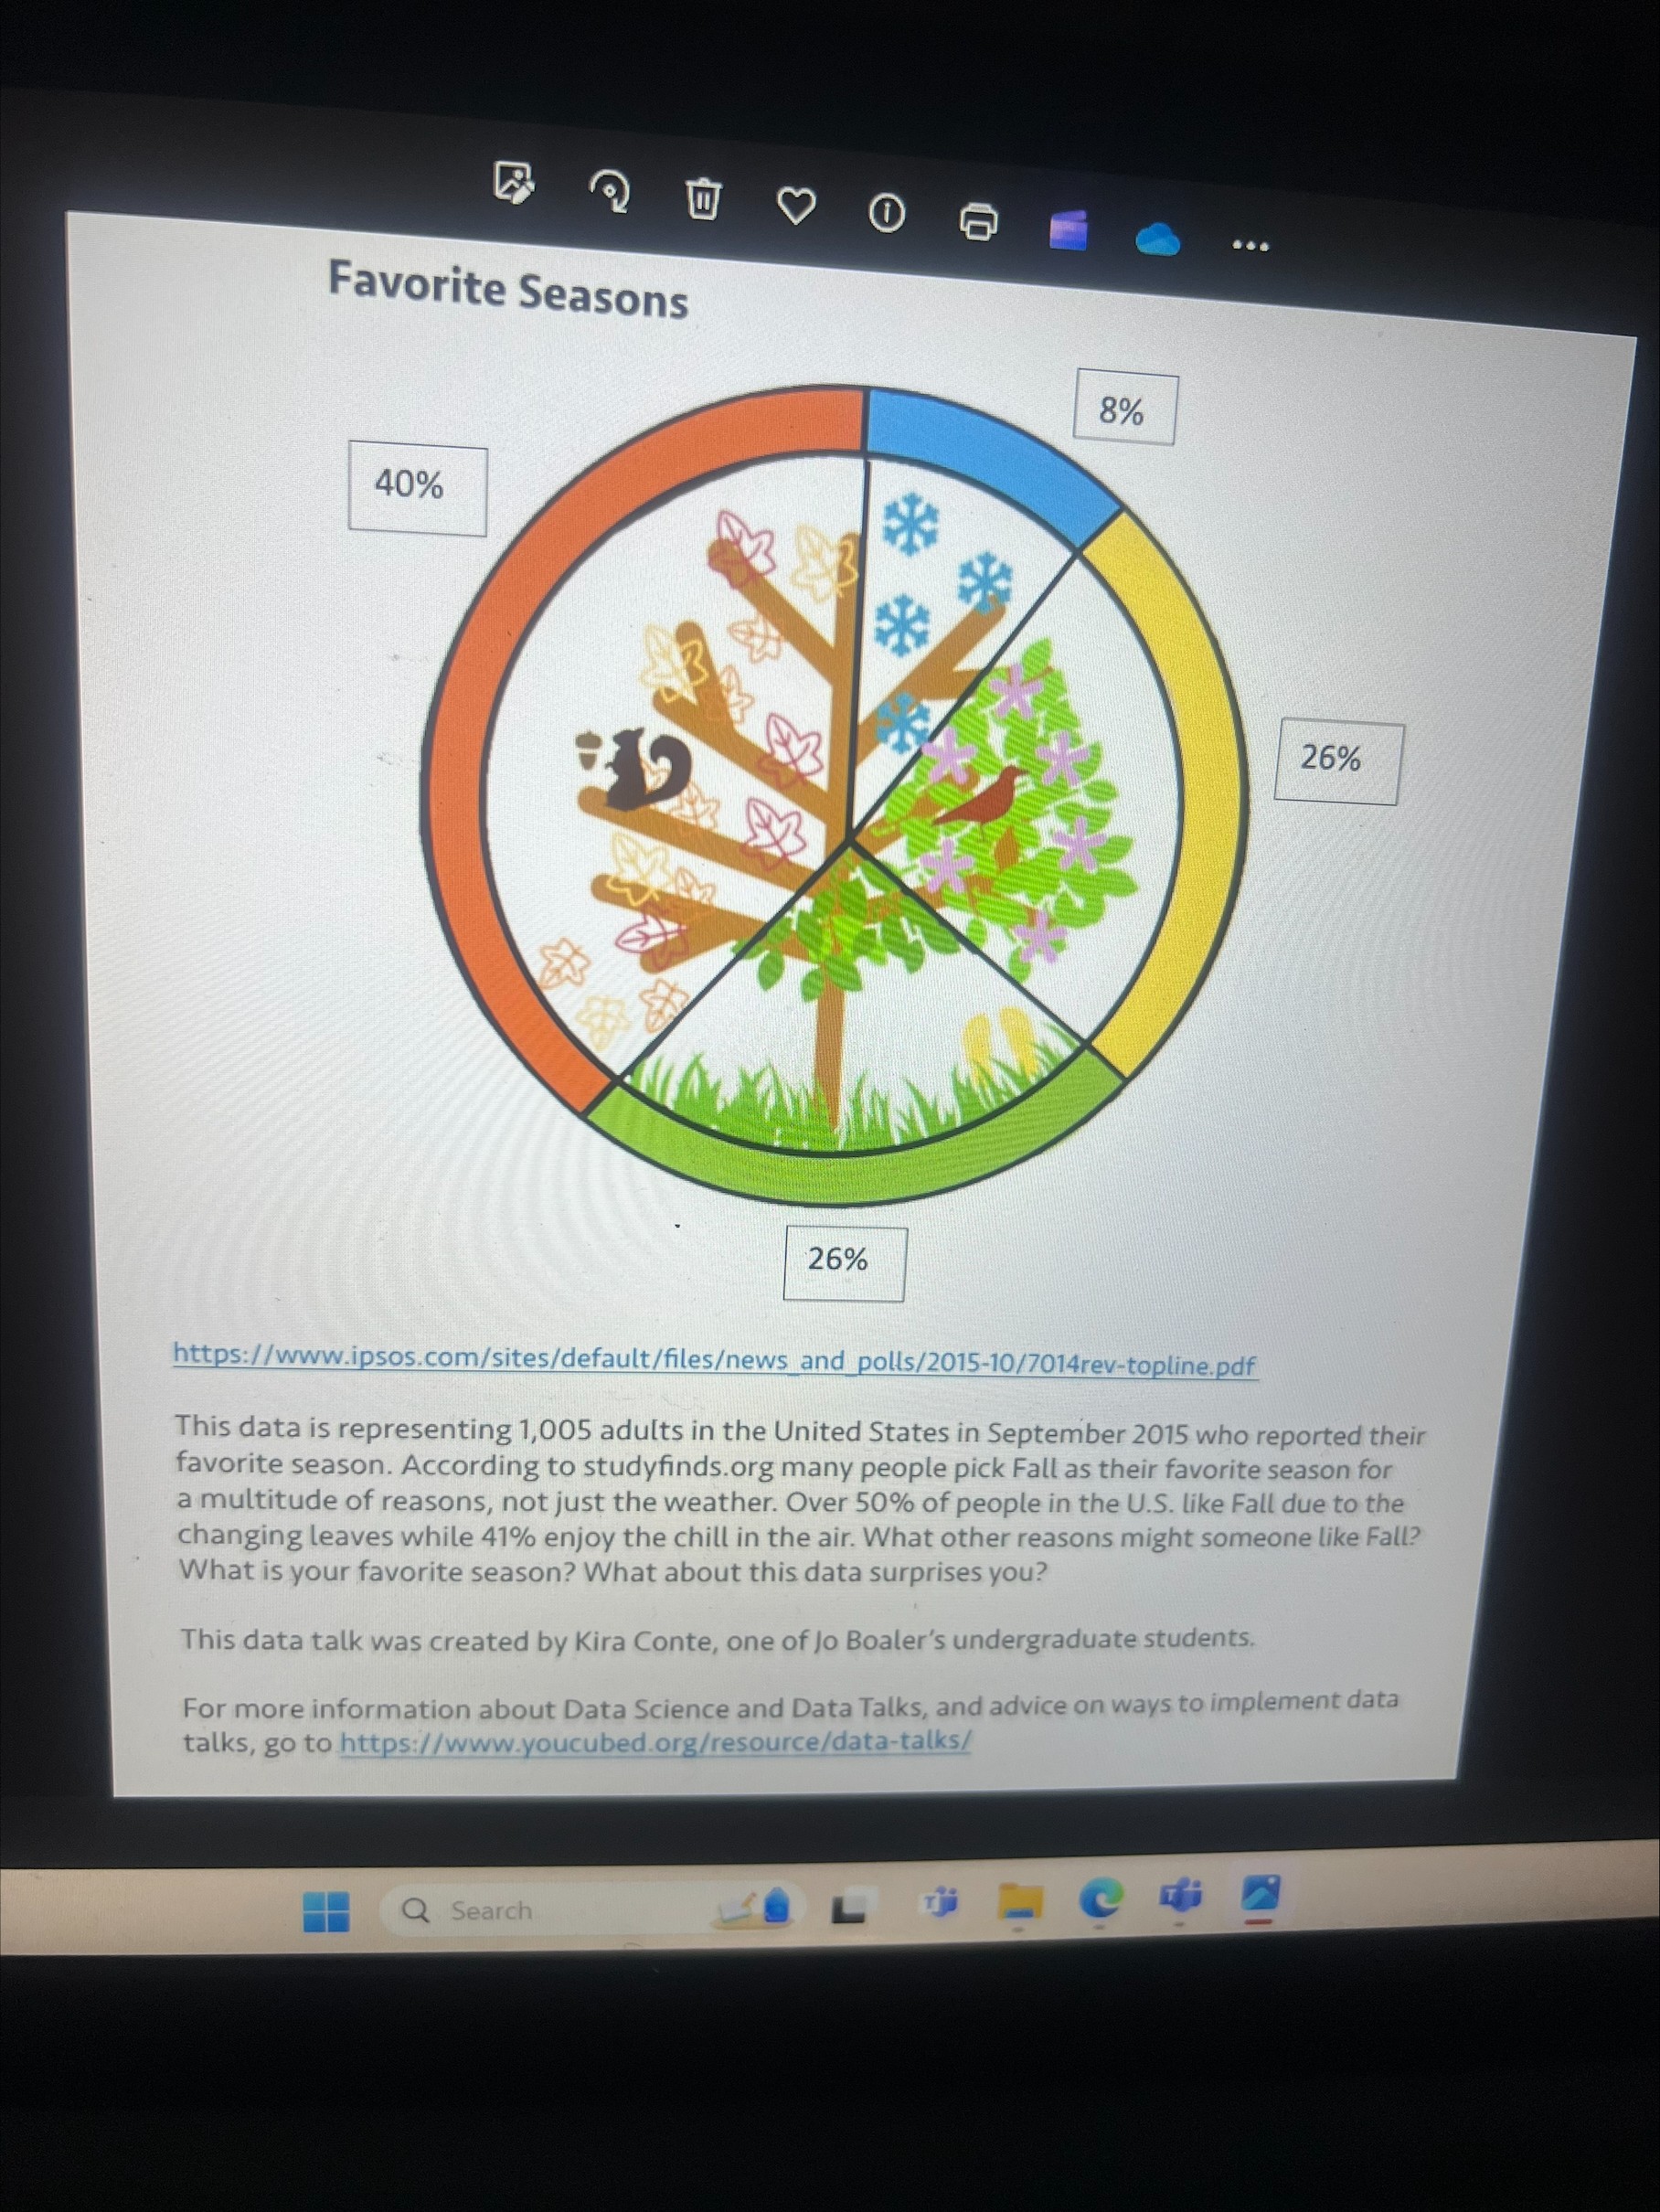
file This data is representing 1,005 adults in the United States in September 2015 who reported their favorite season. According to studyfinds.org many people pick Fall as their favorite season for a multitude of reasons, not just the weather. Over 50% of people in the U.S. like Fall due to the changing leaves while 41% enjoy the chill in the air. What other reasons might someone like Fall? What is your favorite season? What about this data surprises you? ) 3 Talk was created by Kira Conte, one of Jo Boaler's undergraduate students For more information about Data Science and Data Talks, and agvice O/ talks 0 to hit v i INCE 1ata-Talks | VWW.Y
Step by Step Solution
There are 3 Steps involved in it

Get step-by-step solutions from verified subject matter experts