

Question: Learning Objectives 1. Create a pivot table in Excel 2. Add new calculated field to pivot table 3. Create a bar chart without and with
Learning Objectives
1. Create a pivot table in Excel
2. Add new calculated field to pivot table
3. Create a bar chart without and with line graph
4. Apply appropriate numeric format on pivot tables and charts
5. Analyze and interpret outcome of pivot tables and calculated fields
6. Writing
Data Set Background
Caswell Company is a publicly traded company that has various leasing facilities over a number of years. Since 2019 operating leases have been reported in the balance sheet of the lessee as a right-of-use asset and lease liability. At that time, Caswell had debt covenants restricting the amount of debt during loan periods. Caswell had as part of their loan agreements a requirement that their debt to equity ratio could not exceed 1.75 without being in default of the loans.
The debt to equity ratio provides users of the financial statements an indication of the likelihood a company will default on its obligations. In this project, you will examine Caswells pattern of leasing facilities, their transition to the new lease accounting standards in 2019, and the effect of that transition on debt covenants. The data set contains the elements of the balance sheet of Caswell Corp. for 10 years, 2012 through 2021.
Requirements:
1. Create a pivot table to summarize the long-term portion of the (a) capital lease liability, (b) the finance lease liability, and (c) the operating lease liability over the 10-year period 2012-2021 on a separate worksheet. Label the worksheet LeaseLiability.
2. On the Lease Liability worksheet create a bar chart of the trends for long-term portion of each lease liability classification over the 10-year period classification. Is Caswell pattern of leasing facilities as evidenced by its capital lease liability (a) increasing, (b) decreasing, or (c) remaining relatively the same of the period 2012-2021. Place your answer in the cell below the bar chart.
3. Create a pivot table to summarize the total assets, total liabilities, and total stockholders equity over the 10-year period 2012-2021 (Hint: Need to calculate total liabilities and total stockholders equity for each year) on a separate worksheet. Add calculated field to calculate the debt to equity ratio for the company (carried two decimal places) over the 10-year period 2012-2021. Label the worksheet DebtToEquity.
4. On the DebtToEquity worksheet display the trend of the debt to equity ratio over the 10-year period 2012-2021 using a bar chart with line graph. Is Caswells debt to equity AC 313 Intermediate Accounting III, Fall 2021 ratio over the 10-year period (a) generally increasing, (b) roughly the same, or (c) generally decreasing from year to year? Place your answer in the cell below the bar chart.
5. Is Caswell Company. technically in violation of its debt covenant during the period 2019-2021? Place your answer in cell below your response to #4.
6. The worksheets should be formatted with appropriate numeric values using accounting format with zero decimals unless indicated otherwise.
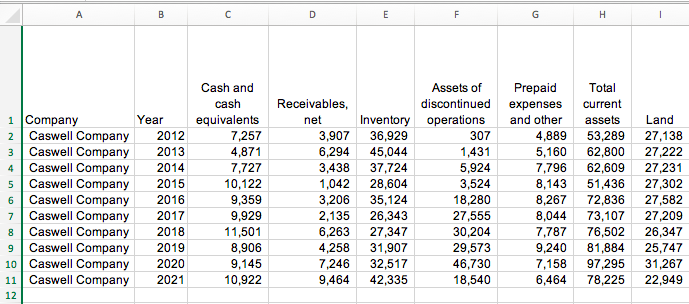
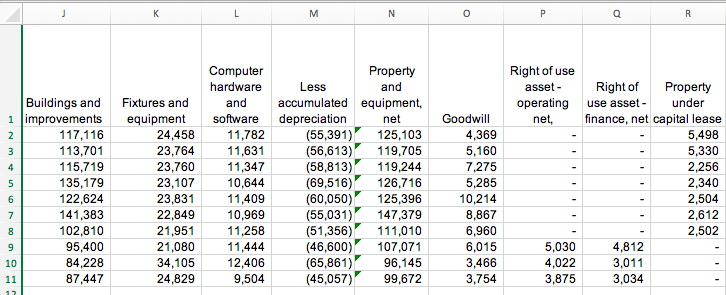
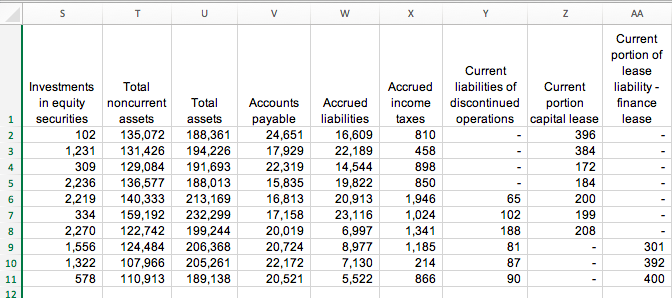
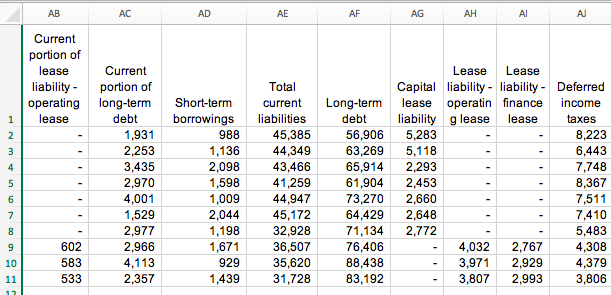
A B D E F G H 1 Company Year 2 Caswell Company 2012 3 Caswell Company 2013 4 Caswell Company 2014 5 Caswell Company 2015 6 Caswell Company 2016 7 Caswell Company 2017 Caswell Company 2018 9 Caswell Company 2019 10 Caswell Company 2020 11 Caswell Company 2021 12 NM N O Cash and cash equivalents 7,257 4,871 7,727 10,122 9,359 9,929 11,501 8,906 9,145 10,922 Receivables, net 3,907 6,294 3,438 1,042 3,206 2,135 6,263 4,258 7,246 9,464 Assets of Prepaid Total discontinued expenses current Inventory operations and other assets 36,929 307 4,889 53,289 45,044 1,431 5,160 62,800 37,724 5,924 7,796 62,609 28,604 3,524 8,143 51,436 35,124 18,280 8,267 72,836 26,343 27,555 8,044 73,107 27,347 30,204 7,787 76,502 31,907 29,573 9,240 81,884 32,517 46,730 7,158 97,295 42,335 18,540 6,464 78,225 Land 27,138 27,222 27,231 27,302 27,582 27,209 26,347 25,747 31,267 22,949 L M N o P o R 4 Buildings and 1 improvements 2 117,116 3 113,701 115,719 5 135,179 6 122,624 7 141,383 102,810 9 95,400 10 84,228 11 87,447 Fixtures and equipment 24,458 23,764 23,760 23,107 23,831 22,849 21,951 21,080 34,105 24,829 Computer hardware and software 11,782 11,631 11,347 10,644 11,409 10,969 11,258 11,444 12,406 9,504 Property Less and accumulated equipment, depreciation net (55,391) 125,103 (56,613) 119,705 (58,813) 119,244 (69,516) 126,716 (60,050) 125,396 (55,031) 147,379 (51,356) 111,010 (46,600) 107,071 (65,861) 96,145 (45,057) 99,672 Goodwill 4,369 5,160 7,275 5,285 10,214 8,867 6,960 6,015 3,466 3,754 Right of use asset- Right of Property operating use asset- under net finance, net capital lease 5,498 5,330 2,256 2,340 2,504 2,612 2,502 5,030 4,812 4,022 3,011 3,875 3,034 S T U > W X N AA Current portion of lease liability - finance lease 1 Nm 4 Investments in equity securities 102 1,231 309 2,236 2,219 334 2,270 1,556 1,322 578 5 Total noncurrent assets 135,072 131,426 129,084 136,577 140,333 159,192 122,742 124,484 107,966 110,913 Total assets 188,361 194,226 191,693 188,013 213,169 232,299 199,244 206,368 205,261 189,138 Accounts payable 24,651 17,929 22,319 15,835 16,813 17,158 20,019 20,724 22,172 20,521 Accrued liabilities 16,609 22,189 14,544 19,822 20,913 23,116 6,997 8,977 7,130 5,522 Accrued income taxes 810 458 898 850 1,946 1,024 1,341 1,185 214 866 Current liabilities of Current discontinued portion operations capital lease 396 384 172 184 65 200 102 199 188 208 81 87 6 7 9 10 11 12 301 392 400 90 AB AC AD AE AF AG AH AJ 1 NMNO Current portion of lease Current liability - portion of operating long-term lease debt 1,931 2,253 3,435 2,970 4,001 1,529 2,977 602 2,966 583 4,113 533 2,357 Short-term borrowings 988 1,136 2,098 1,598 1,009 2,044 1,198 1,671 929 1,439 Total current liabilities 45,385 44,349 43,466 41,259 44,947 45,172 32,928 36,507 35,620 31,728 Long-term debt 56,906 63,269 65,914 61,904 73,270 64,429 71,134 76,406 88,438 83,192 Lease Lease Capital liability - liability - Deferred lease operatin finance income liability glease lease taxes 5,283 8,223 5,118 6,443 2,293 7,748 2,453 8,367 2,660 7,511 2,648 7,410 2,772 5,483 4,032 2,767 4,308 3,971 2,929 4,379 3,807 2,993 3,806 9 10 11 A B D E F G H 1 Company Year 2 Caswell Company 2012 3 Caswell Company 2013 4 Caswell Company 2014 5 Caswell Company 2015 6 Caswell Company 2016 7 Caswell Company 2017 Caswell Company 2018 9 Caswell Company 2019 10 Caswell Company 2020 11 Caswell Company 2021 12 NM N O Cash and cash equivalents 7,257 4,871 7,727 10,122 9,359 9,929 11,501 8,906 9,145 10,922 Receivables, net 3,907 6,294 3,438 1,042 3,206 2,135 6,263 4,258 7,246 9,464 Assets of Prepaid Total discontinued expenses current Inventory operations and other assets 36,929 307 4,889 53,289 45,044 1,431 5,160 62,800 37,724 5,924 7,796 62,609 28,604 3,524 8,143 51,436 35,124 18,280 8,267 72,836 26,343 27,555 8,044 73,107 27,347 30,204 7,787 76,502 31,907 29,573 9,240 81,884 32,517 46,730 7,158 97,295 42,335 18,540 6,464 78,225 Land 27,138 27,222 27,231 27,302 27,582 27,209 26,347 25,747 31,267 22,949 L M N o P o R 4 Buildings and 1 improvements 2 117,116 3 113,701 115,719 5 135,179 6 122,624 7 141,383 102,810 9 95,400 10 84,228 11 87,447 Fixtures and equipment 24,458 23,764 23,760 23,107 23,831 22,849 21,951 21,080 34,105 24,829 Computer hardware and software 11,782 11,631 11,347 10,644 11,409 10,969 11,258 11,444 12,406 9,504 Property Less and accumulated equipment, depreciation net (55,391) 125,103 (56,613) 119,705 (58,813) 119,244 (69,516) 126,716 (60,050) 125,396 (55,031) 147,379 (51,356) 111,010 (46,600) 107,071 (65,861) 96,145 (45,057) 99,672 Goodwill 4,369 5,160 7,275 5,285 10,214 8,867 6,960 6,015 3,466 3,754 Right of use asset- Right of Property operating use asset- under net finance, net capital lease 5,498 5,330 2,256 2,340 2,504 2,612 2,502 5,030 4,812 4,022 3,011 3,875 3,034 S T U > W X N AA Current portion of lease liability - finance lease 1 Nm 4 Investments in equity securities 102 1,231 309 2,236 2,219 334 2,270 1,556 1,322 578 5 Total noncurrent assets 135,072 131,426 129,084 136,577 140,333 159,192 122,742 124,484 107,966 110,913 Total assets 188,361 194,226 191,693 188,013 213,169 232,299 199,244 206,368 205,261 189,138 Accounts payable 24,651 17,929 22,319 15,835 16,813 17,158 20,019 20,724 22,172 20,521 Accrued liabilities 16,609 22,189 14,544 19,822 20,913 23,116 6,997 8,977 7,130 5,522 Accrued income taxes 810 458 898 850 1,946 1,024 1,341 1,185 214 866 Current liabilities of Current discontinued portion operations capital lease 396 384 172 184 65 200 102 199 188 208 81 87 6 7 9 10 11 12 301 392 400 90 AB AC AD AE AF AG AH AJ 1 NMNO Current portion of lease Current liability - portion of operating long-term lease debt 1,931 2,253 3,435 2,970 4,001 1,529 2,977 602 2,966 583 4,113 533 2,357 Short-term borrowings 988 1,136 2,098 1,598 1,009 2,044 1,198 1,671 929 1,439 Total current liabilities 45,385 44,349 43,466 41,259 44,947 45,172 32,928 36,507 35,620 31,728 Long-term debt 56,906 63,269 65,914 61,904 73,270 64,429 71,134 76,406 88,438 83,192 Lease Lease Capital liability - liability - Deferred lease operatin finance income liability glease lease taxes 5,283 8,223 5,118 6,443 2,293 7,748 2,453 8,367 2,660 7,511 2,648 7,410 2,772 5,483 4,032 2,767 4,308 3,971 2,929 4,379 3,807 2,993 3,806 9 10 11
Step by Step Solution
There are 3 Steps involved in it

Get step-by-step solutions from verified subject matter experts