

Question: Lemons : E1 E2 170 BO B2B1 Oranges A B C 0 The following graph shows a consumer's decision Budget constraint has shifted to the
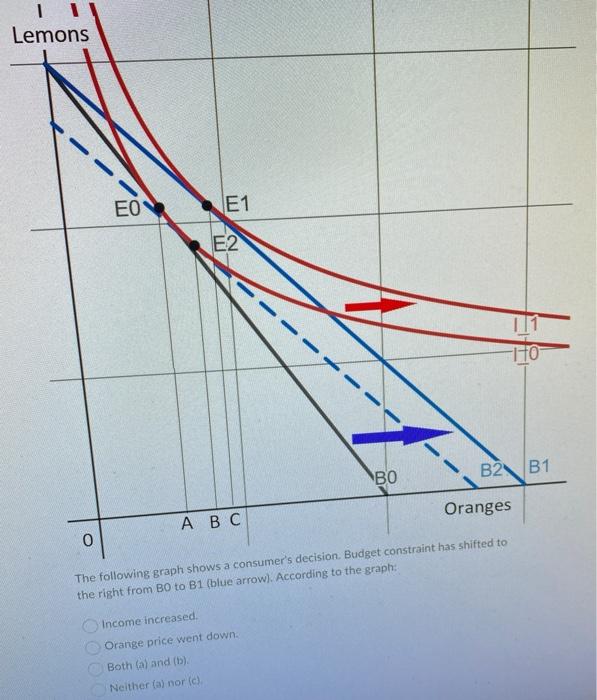
Lemons : E1 E2 170 BO B2B1 Oranges A B C 0 The following graph shows a consumer's decision Budget constraint has shifted to the right from BO to B1 (blue arrow). According to the graph: Income increased Orange price went down. Both (a) and (t)) Neither (a) nor (c)
Step by Step Solution
There are 3 Steps involved in it
1 Expert Approved Answer
Step: 1 Unlock

It seems like youve provided a description of a graph related to a consumers budget constraint b... View full answer
Question Has Been Solved by an Expert!
Get step-by-step solutions from verified subject matter experts
Step: 2 Unlock
Step: 3 Unlock