

Question: Let g(z) f(t) dr, where is the function whose graph is shown below you can assume the graph of fis symmetric across the y-axis
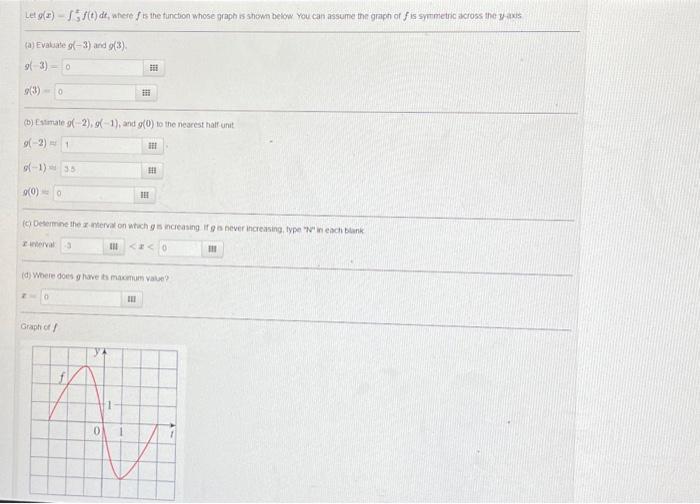
Let g(z) f(t) dr, where is the function whose graph is shown below you can assume the graph of fis symmetric across the y-axis (a) Evaluate g(-3) and g(3). 93) 9(3) 0 0 (b) Estimate g(-2), g(-1), and g(0) to the nearest half unit 9(-2)1 9(0) 0 35 (c) Determine the interval on which gis increasing. If g is never increasing, type "N" in each blank interval 3 0 (d) Where does g have its maximum value? Graph off 0
Step by Step Solution
There are 3 Steps involved in it
1 Expert Approved Answer
Step: 1 Unlock

Question Has Been Solved by an Expert!
Get step-by-step solutions from verified subject matter experts
Step: 2 Unlock
Step: 3 Unlock