

Question: letter C please Choose the correct x-chart for the data below. The entire process is control. c. In part (b), if you concluded that the
letter C please 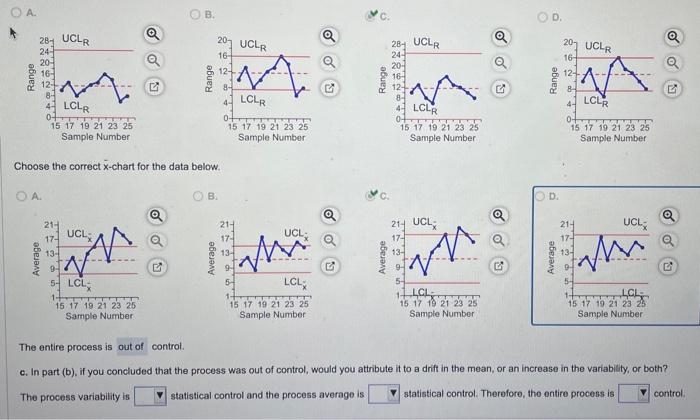
Choose the correct x-chart for the data below. The entire process is control. c. In part (b), if you concluded that the process was out of control, would you attribute it to a drift in the mean, or an increase in the variability, or both? The process variability is statistical control and the process average is statistical control. Therefore, the ontire process is
Step by Step Solution
There are 3 Steps involved in it
1 Expert Approved Answer
Step: 1 Unlock

Question Has Been Solved by an Expert!
Get step-by-step solutions from verified subject matter experts
Step: 2 Unlock
Step: 3 Unlock