

Question: line : a) Review the section plotting of data. On graph paper, draw the 7 = =x + 10 On the same graph, plot the
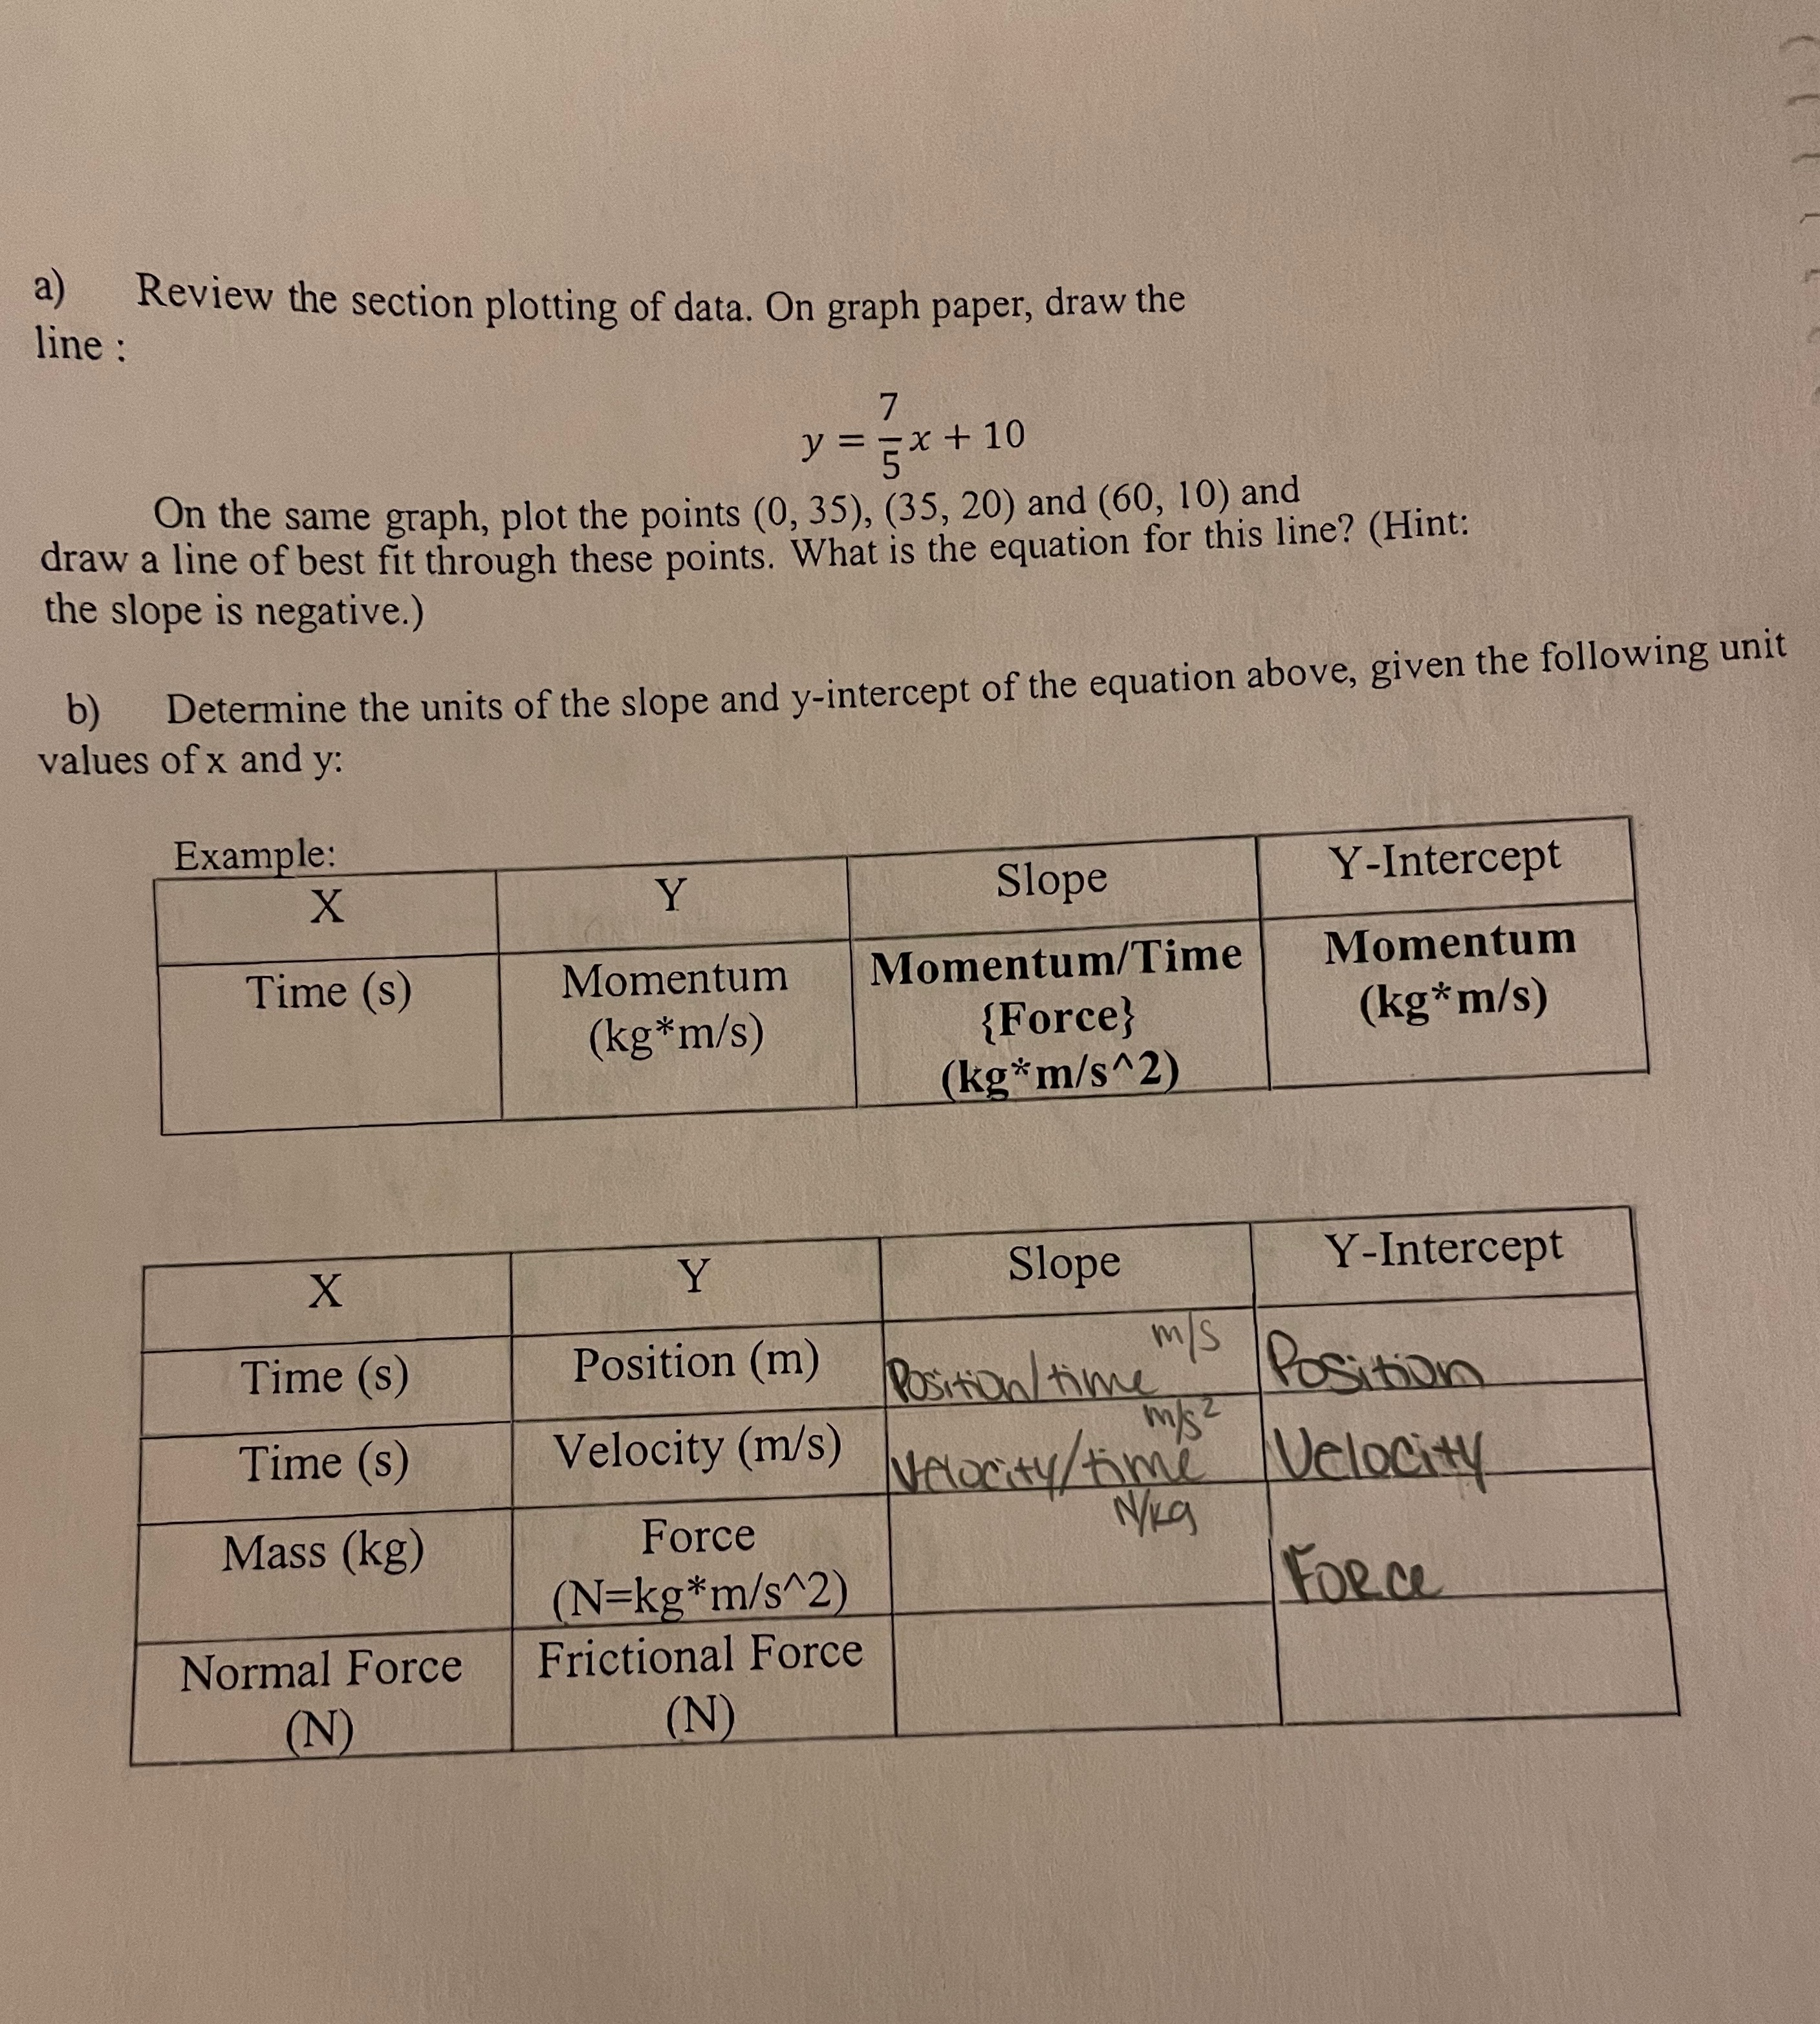
line : a) Review the section plotting of data. On graph paper, draw the 7 = =x + 10 On the same graph, plot the points (0, 35), (35, 20) and (60, 10) and draw a line of best fit through these points. What is the equation for this line? (Hint: the slope is negative.) b) Determine the units of the slope and y-intercept of the equation above, given the following unit values of x and y: Example: X Y Slope Y-Intercept Time (s) Momentum Momentum/Time Momentum (kg*m/s) {Force} (kg*m/s) (kg*m/s^2) X Y Slope Y-Intercept Time (s) Position (m) m/S Position / time Position Time (s) Velocity (m/s) m/s 2 Velocity/time Velocity Mass (kg) Force N/kg (N=kg*m/s^2) Force Normal Force Frictional Force (N (N
Step by Step Solution
There are 3 Steps involved in it

Get step-by-step solutions from verified subject matter experts