

Question: Please answer question one parts a,b, and c Estimates Queue * DISCUSSION 4 - Sp20 Colle x Microsoft Word - DISCUSSIX C Get Homework Help
Please answer question one parts a,b, and c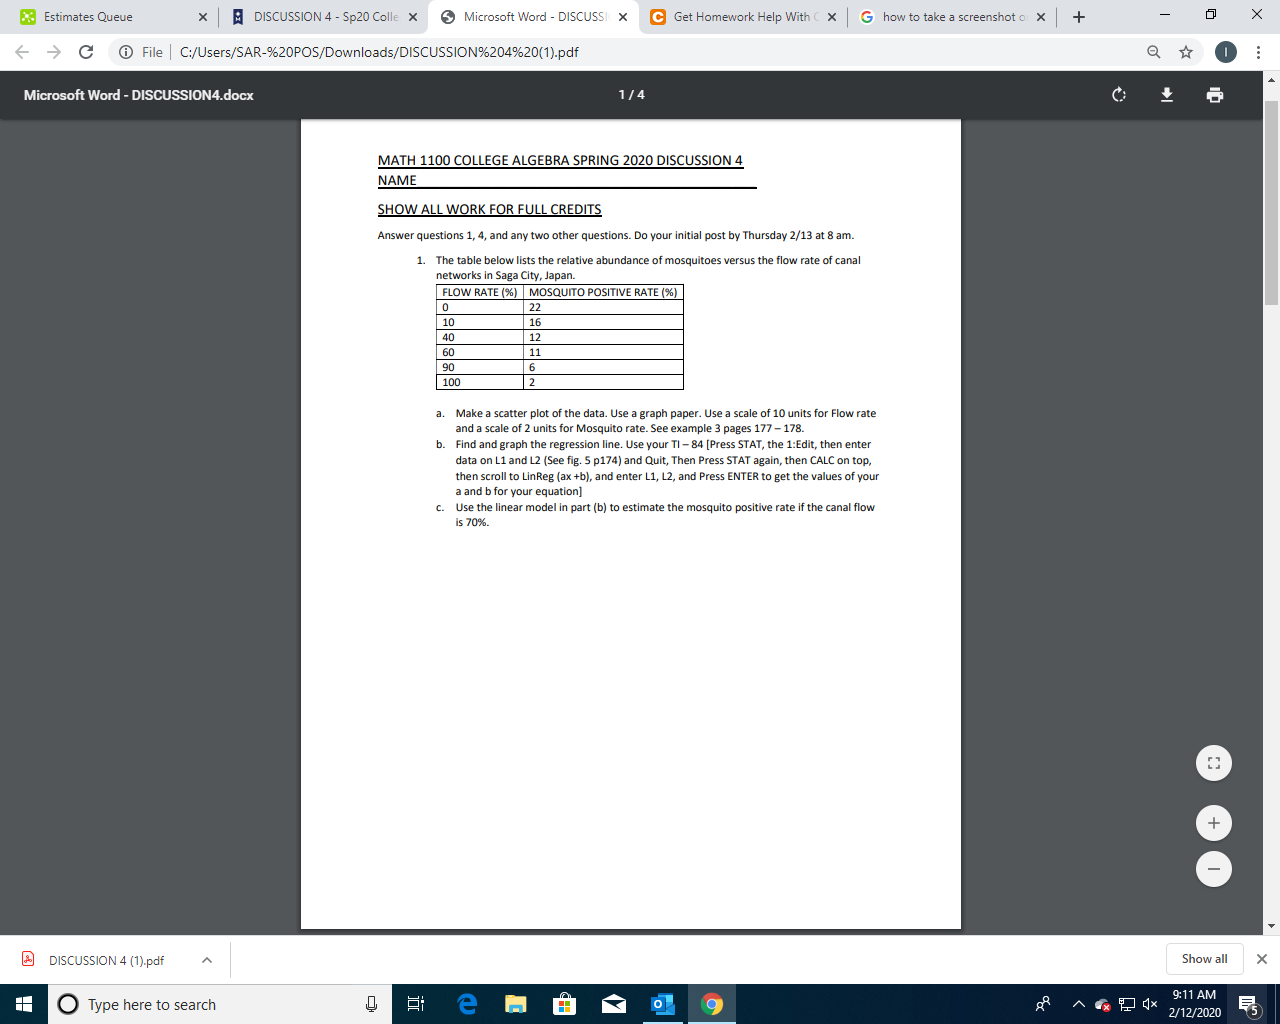
Estimates Queue * DISCUSSION 4 - Sp20 Colle x Microsoft Word - DISCUSSIX C Get Homework Help With x G how to take a screenshoto x +. - O X c File C:/Users/SAR-%20POS/Downloads/DISCUSSION%204%20(1).pdf Q 0 : Microsoft Word - DISCUSSION4.docx 1/4 MATH 1100 COLLEGE ALGEBRA SPRING 2020 DISCUSSION 4 NAME SHOW ALL WORK FOR FULL CREDITS Answer questions 1, 4, and any two other questions. Do your initial post by Thursday 2/13 at 8 am. 1. The table below lists the relative abundance of mosquitoes versus the flow rate of canal networks in Saga City, Japan. FLOW RATE (%) MOSQUITO POSITIVE RATE (%) 22 10 40 906 1002 a. Make a scatter plot of the data. Use a graph paper. Use a scale of 10 units for Flow rate and a scale of 2 units for Mosquito rate. See example 3 pages 177-178. b. Find and graph the regression line. Use your TI-84 [Press STAT, the 1:Edit, then enter data on L1 and L2 (See fig. 5 p174) and Quit, Then Press STAT again, then CALC on top, then scroll to LinReg (ax +b), and enter L1, L2, and Press ENTER to get the values of your a and b for your equation] c. Use the linear model in part (b) to estimate the mosquito positive rate if the canal flow is 70%. DISCUSSION 4 (1).pdf - Show all X 9:11 AM O Type here to search op ^ ? 1* 2/12/2020 35 Estimates Queue * DISCUSSION 4 - Sp20 Colle x Microsoft Word - DISCUSSIX C Get Homework Help With x G how to take a screenshoto x +. - O X c File C:/Users/SAR-%20POS/Downloads/DISCUSSION%204%20(1).pdf Q 0 : Microsoft Word - DISCUSSION4.docx 1/4 MATH 1100 COLLEGE ALGEBRA SPRING 2020 DISCUSSION 4 NAME SHOW ALL WORK FOR FULL CREDITS Answer questions 1, 4, and any two other questions. Do your initial post by Thursday 2/13 at 8 am. 1. The table below lists the relative abundance of mosquitoes versus the flow rate of canal networks in Saga City, Japan. FLOW RATE (%) MOSQUITO POSITIVE RATE (%) 22 10 40 906 1002 a. Make a scatter plot of the data. Use a graph paper. Use a scale of 10 units for Flow rate and a scale of 2 units for Mosquito rate. See example 3 pages 177-178. b. Find and graph the regression line. Use your TI-84 [Press STAT, the 1:Edit, then enter data on L1 and L2 (See fig. 5 p174) and Quit, Then Press STAT again, then CALC on top, then scroll to LinReg (ax +b), and enter L1, L2, and Press ENTER to get the values of your a and b for your equation] c. Use the linear model in part (b) to estimate the mosquito positive rate if the canal flow is 70%. DISCUSSION 4 (1).pdf - Show all X 9:11 AM O Type here to search op ^ ? 1* 2/12/2020 35
Step by Step Solution
There are 3 Steps involved in it

Get step-by-step solutions from verified subject matter experts