

Question: LINEAR MODELING PROJECT For this project, you are to use the provided information to create a linear model for the corresponding data. Please be sure
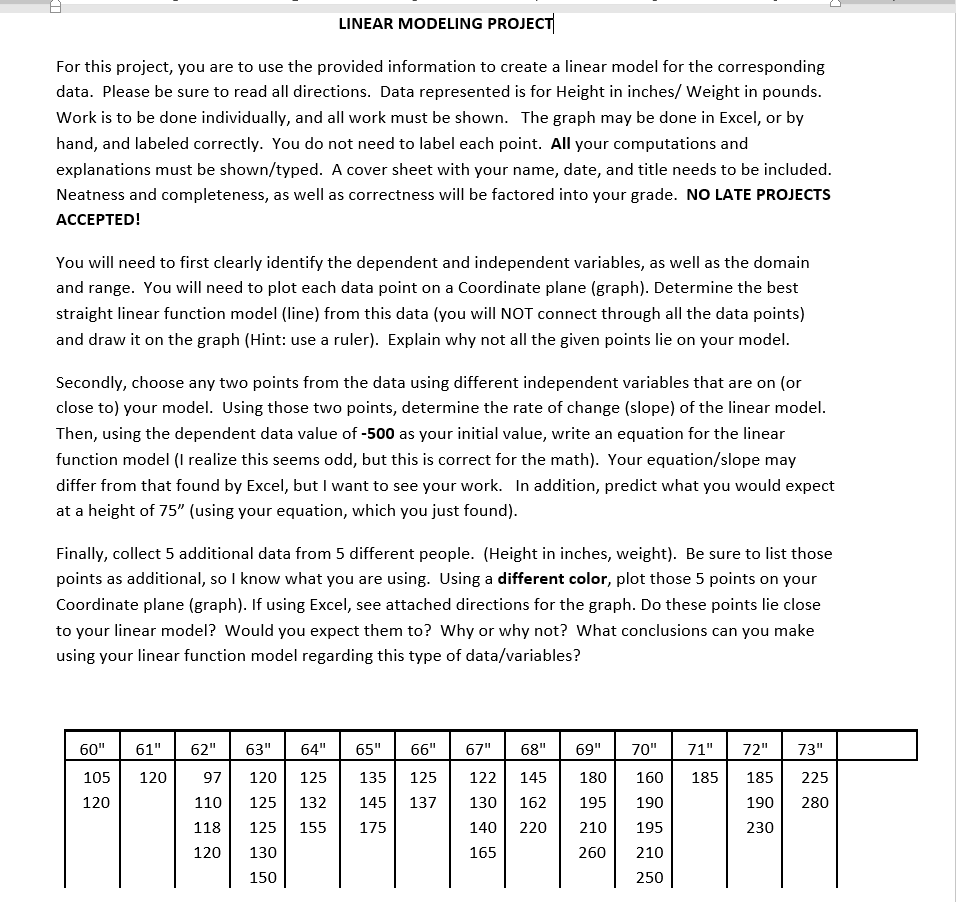
LINEAR MODELING PROJECT For this project, you are to use the provided information to create a linear model for the corresponding data. Please be sure to read all directions. Data represented is for Height in inches/ Weight in pounds. Work is to be done individually, and all work must be shown. The graph may be done in Excel, or by hand, and labeled correctly. You do not need to label each point. All your computations and explanations must be shown/typed. A cover sheet with your name, date, and title needs to be included. Neatness and completeness, as well as correctness will be factored into your grade. NO LATE PROJECTS ACCEPTED! You will need to first clearly identify the dependent and independent variables, as well as the domain and range. You will need to plot each data point on a Coordinate plane (graph). Determine the best straight linear function model (line) from this data (you will NOT connect through all the data points) and draw it on the graph (Hint: use a ruler). Explain why not all the given points lie on your model. Secondly, choose any two points from the data using different independent variables that are on (or close to) your model. Using those two points, determine the rate of change (slope) of the linear model. Then, using the dependent data value of -500 as your initial value, write an equation for the linear function model (I realize this seems odd, but this is correct for the math). Your equation/slope may differ from that found by Excel, but I want to see your work. In addition, predict what you would expect at a height of 75" (using your equation, which you just found). Finally, collect 5 additional data from 5 different people. (Height in inches, weight). Be sure to list those points as additional, so I know what you are using. Using a different color, plot those 5 points on your Coordinate plane (graph). If using Excel, see attached directions for the graph. Do these points lie close to your linear model? Would you expect them to? Why or why not? What conclusions can you make using your linear function model regarding this type of data/variables? 60" 61" 62" 63" 64" 65" 66" 67" 68" 69" 70" 71" 72" 73" 120 97 120 122 180 185 185 105 120 135 145 125 132 155 125 137 145 162 225 280 125 195 110 118 120 190 160 190 195 210 125 130 140 165 175 220 230 130 260 150 250 LINEAR MODELING PROJECT For this project, you are to use the provided information to create a linear model for the corresponding data. Please be sure to read all directions. Data represented is for Height in inches/ Weight in pounds. Work is to be done individually, and all work must be shown. The graph may be done in Excel, or by hand, and labeled correctly. You do not need to label each point. All your computations and explanations must be shown/typed. A cover sheet with your name, date, and title needs to be included. Neatness and completeness, as well as correctness will be factored into your grade. NO LATE PROJECTS ACCEPTED! You will need to first clearly identify the dependent and independent variables, as well as the domain and range. You will need to plot each data point on a Coordinate plane (graph). Determine the best straight linear function model (line) from this data (you will NOT connect through all the data points) and draw it on the graph (Hint: use a ruler). Explain why not all the given points lie on your model. Secondly, choose any two points from the data using different independent variables that are on (or close to) your model. Using those two points, determine the rate of change (slope) of the linear model. Then, using the dependent data value of -500 as your initial value, write an equation for the linear function model (I realize this seems odd, but this is correct for the math). Your equation/slope may differ from that found by Excel, but I want to see your work. In addition, predict what you would expect at a height of 75" (using your equation, which you just found). Finally, collect 5 additional data from 5 different people. (Height in inches, weight). Be sure to list those points as additional, so I know what you are using. Using a different color, plot those 5 points on your Coordinate plane (graph). If using Excel, see attached directions for the graph. Do these points lie close to your linear model? Would you expect them to? Why or why not? What conclusions can you make using your linear function model regarding this type of data/variables? 60" 61" 62" 63" 64" 65" 66" 67" 68" 69" 70" 71" 72" 73" 120 97 120 122 180 185 185 105 120 135 145 125 132 155 125 137 145 162 225 280 125 195 110 118 120 190 160 190 195 210 125 130 140 165 175 220 230 130 260 150 250
Step by Step Solution
There are 3 Steps involved in it

Get step-by-step solutions from verified subject matter experts