

Question: linear regression please help quick!! 91 The following is the simple linear regression model: y = Bo + Bx For a given set of (x;;
linear regression
please help quick!!
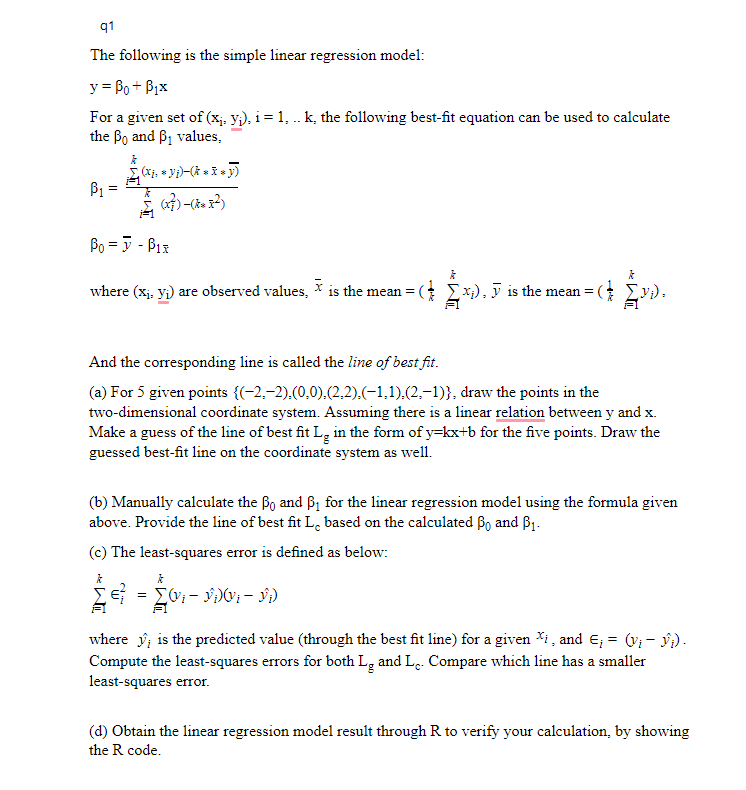
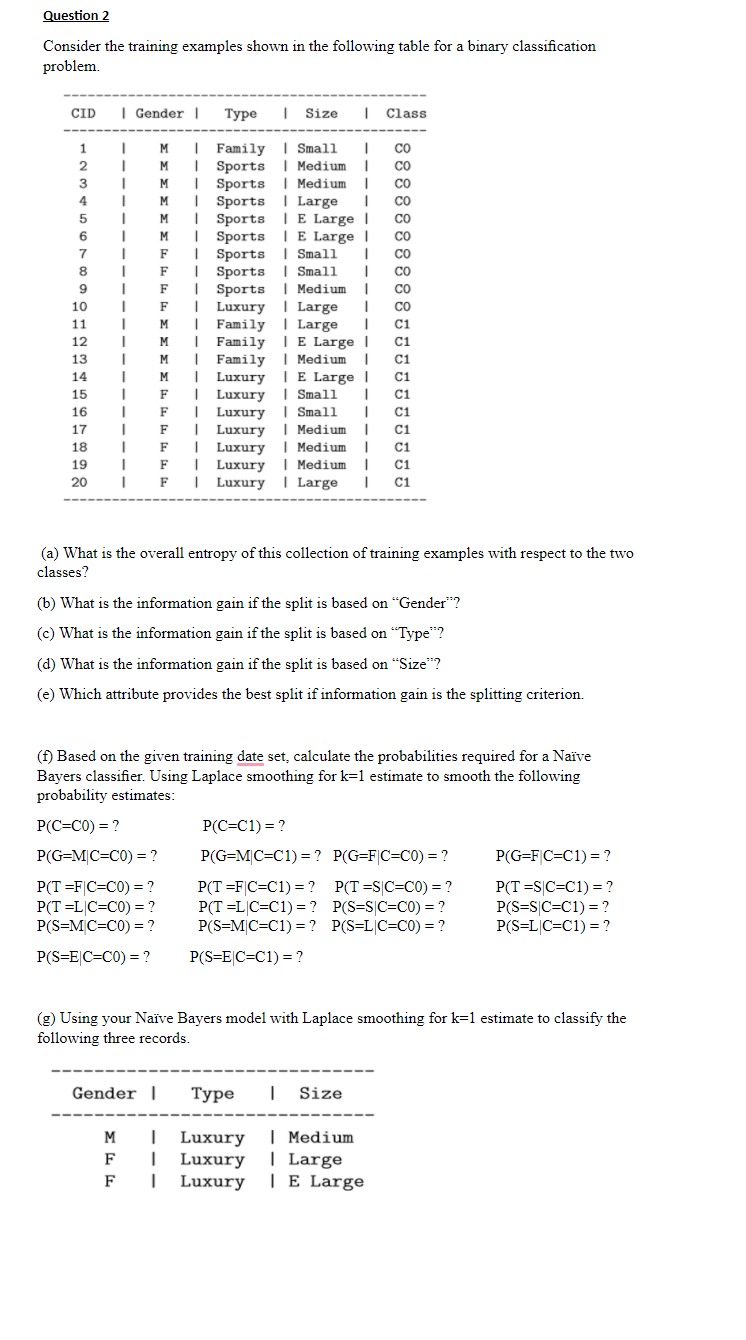
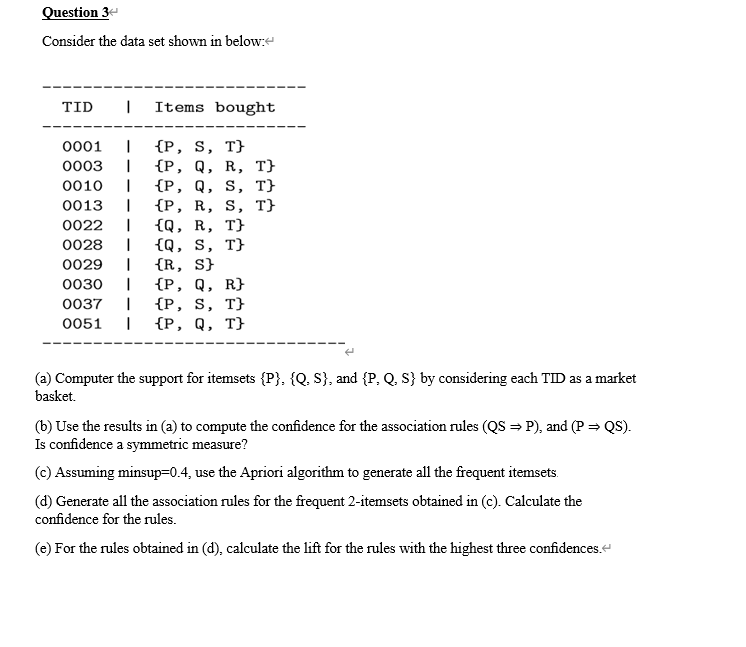
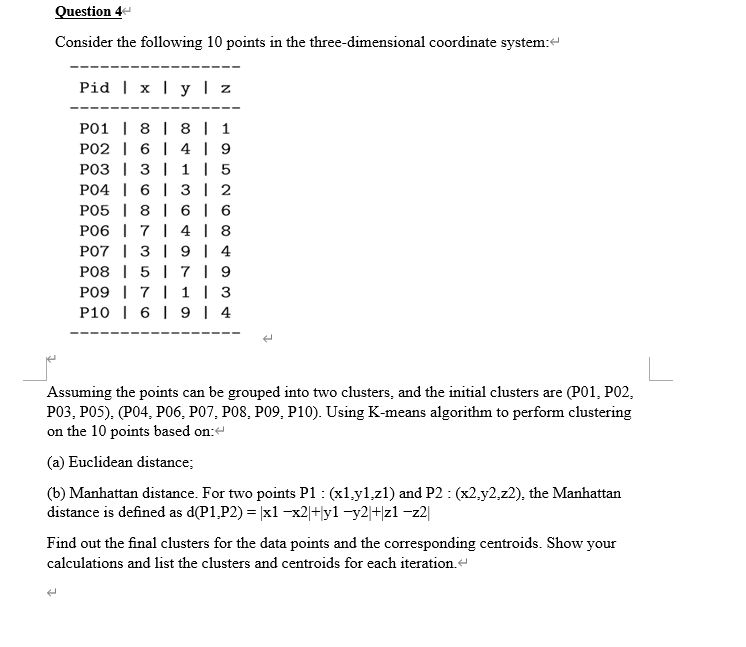
91 The following is the simple linear regression model: y = Bo + Bx For a given set of (x;; yj),i= 1, .. k, the following best-fit equation can be used to calculate the Bo and B, values, 5 B1 (*;. syp)-(t=1:17 (27)-(k*72) Bo = 7 - BLE where (Xj: y, are observed values, * is the mean = x;), is the mean = And the corresponding line is called the line of best fit. (a) For 5 given points {(-2,-2).(0,0).(2.2).(-1,1).(2.-1)}, draw the points in the two-dimensional coordinate system. Assuming there is a linear relation between y and x. Make a guess of the line of best fit L in the form of y=kx+b for the five points. Draw the guessed best-fit line on the coordinate system as well. k k (b) Manually calculate the Bo and B, for the linear regression model using the formula given above. Provide the line of best fit Le based on the calculated Bo and B1- (c) The least-squares error is defined as below: Es} = 01- 970:- ) where y; is the predicted value (through the best fit line) for a given ti, and ; = (V; - ;). Compute the least-squares errors for both L, and L. Compare which line has a smaller least-squares error. (d) Obtain the linear regression model result through R to verify your calculation, by showing the R code. Question 2 Consider the training examples shown in the following table for a binary classification problem CID I Gender Type | Size | Class 1 2 3 CO CO co 4 5 CO 6 7 8 9 10 11 12 13 14 1 1 1 1 1 1 1 1 1 1 1 1 I 1 I 1 I 1 1 M Family Small 1 M | Sports Medium M | Sports Medium M | Sports Large 1 MI Sports E Large M | Sports | E Large F Sports | Small 1 F | Sports Small 1 F | Sports Medium F | Luxury Large 1 M 1 Family Large 1 M | Family | E Large 1 M Family | Medium I M | Luxury | E Large F | Luxury Small 1 F | Luxury Small 1 F 1 I Luxury Medium F | Luxury Medium F | Luxury Medium FLuxury Large 1 15 16 17 18 19 CO C1 C1 C1 C1 C1 C1 C1 C1 C1 C1 20 (a) What is the overall entropy of this collection of training examples with respect to the two classes? (6) What is the information gain if the split is based on "Gender"? c) What is the information gain if the split is based on "Type"? (d) What is the information gain if the split is based on "Size"? (e) Which attribute provides the best split if information gain is the splitting criterion. (f) Based on the given training date set, calculate the probabilities required for a Nave Bayers classifier. Using Laplace smoothing for k=1 estimate to smooth the following probability estimates: P(C=CO) = ? P(C=C1) = ? P(G=MC=CO) = ? P(G=MC=C1) = ? P(G=FC=CO) = ? P(G=F C=C1) = ? P(T=F C=CO) = ? P(T=F C=C1) = ? P(T =S C=C0) = ? P(TES C=C1) = ? P(T EL C=C0) = ? P(T EL C=C1) = ? P(S=SC=CO) = ? P(S=SC=C1) = ? P(SEM C=CO) = ? P(S=MC=C1) = ? P(SEL C=C0) = ? P(SEL C=C1) = ? P(S=E C=CO) = ? P(S=E C=C1) = ? (g) Using your Nave Bayers model with Laplace smoothing for k=1 estimate to classify the following three records. Gender Type 1 Size M F F I Luxury | Medium | Luxury | Large I Luxury | E Large Question 3 Consider the data set shown in below: TID 1 Items bought 0001 0003 0010 0013 0022 0028 0029 0030 0037 0051 1 I 1 1 1 I 1 1 1 1 {P, S, T} {P, Q, R, T} {P, Q, S, T} {P, R, S, T} {Q, R, T} {Q, S, T} {R, S} {P, Q, R} {P, S, T} {P, Q, T} (2) Computer the support for itemsets {P}, {Q.S), and {P, Q, S} by considering each TID as a market basket. (6) Use the results in (a) to compute the confidence for the association rules (QS =P), and (P=QS). Is confidence a symmetric measure? (c) Assuming minsup=0.4, use the Apriori algorithm to generate all the frequent itemsets. (d) Generate all the association rules for the frequent 2-itemsets obtained in (c). Calculate the confidence for the rules. (e) For the rules obtained in (d), calculate the lift for the rules with the highest three confidences.- Question 4 Consider the following 10 points in the three-dimensional coordinate system: Pid | x | y | z P01 | 8 | 8 | 1 PO2 | 6 | 4 | 9 PO3 | 3 | 1 | 5 P04 | 6 | 3 | 2 PO5 | 8 | 6 | 6 P06 | 7 | 4 | 8 P07 | 3 | 9 | 4 P08 | 5 | 7 | 9 P09 | 7 | 1 | 3 P10 | 6 | 9 | 4 Assuming the points can be grouped into two clusters, and the initial clusters are (P01, PO2, PO3, P05). (PO4. PO6. P07, POS, P09. P10). Using K-means algorithm to perform clustering on the 10 points based on:- (a) Euclidean distance; (b) Manhattan distance. For two points P1 : (x1.yl zl) and P2 : (x2,y2,z2), the Manhattan distance is defined as d(P1,P2) = xl -x2|+ly1 - y2|+|z1 -z2| Find out the final clusters for the data points and the corresponding centroids. Show your calculations and list the clusters and centroids for each iterationStep by Step Solution
There are 3 Steps involved in it
1 Expert Approved Answer
Step: 1 Unlock

Question Has Been Solved by an Expert!
Get step-by-step solutions from verified subject matter experts
Step: 2 Unlock
Step: 3 Unlock