

Question: Linearise the activity data and use the Excel Data Analysis tool on the linearised activity data to perform the linear regression. Show the plot with
Linearise the activity data and use the Excel Data Analysis tool on the linearised activity data to perform the linear regression. Show the plot with the fitted model. Make sure that the plot has the right format, dont just copypaste directly from the Data Analysis tool.
The Excel Data Analysis tool shows the values of the gradient and yintercept with errors, the R coefficient and the standard residual error. Remember how we present values with errors.
What is the initial activity of your sample with an error? Is this value similar to the value you got from the trendline? Remember units. Hint: exxex
begintabularccc
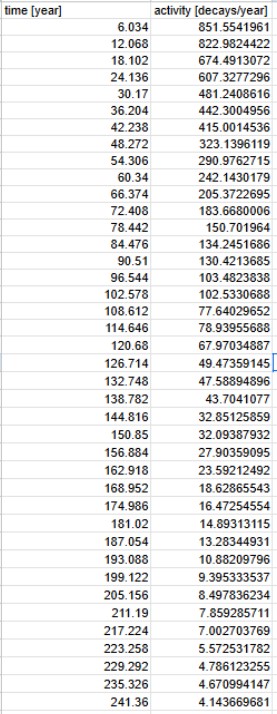
hline time year & & activity decaysyear
hline & &
hline & &
hline & &
hline & &
hline & &
hline & &
hline & &
hline & &
hline & &
hline & &
hline & &
hline & &
hline & &
hline & &
hline & &
hline & &
hline & &
hline & &
hline & &
hline & &
hline & &
hline & &
hline & &
hline & &
hline & &
hline & &
hline & &
hline & &
hline & &
hline & &
hline & &
hline & &
hline & &
hline & &
hline & &
hline & &
hline & &
hline & &
hline & &
hline & &
hline
endtabular
Step by Step Solution
There are 3 Steps involved in it
1 Expert Approved Answer
Step: 1 Unlock

Question Has Been Solved by an Expert!
Get step-by-step solutions from verified subject matter experts
Step: 2 Unlock
Step: 3 Unlock