

Question: ll. Answer the questions below using the cost curves for the price-taking rm shown in the following graph: 60 50 42.50 00-h '40 w 0
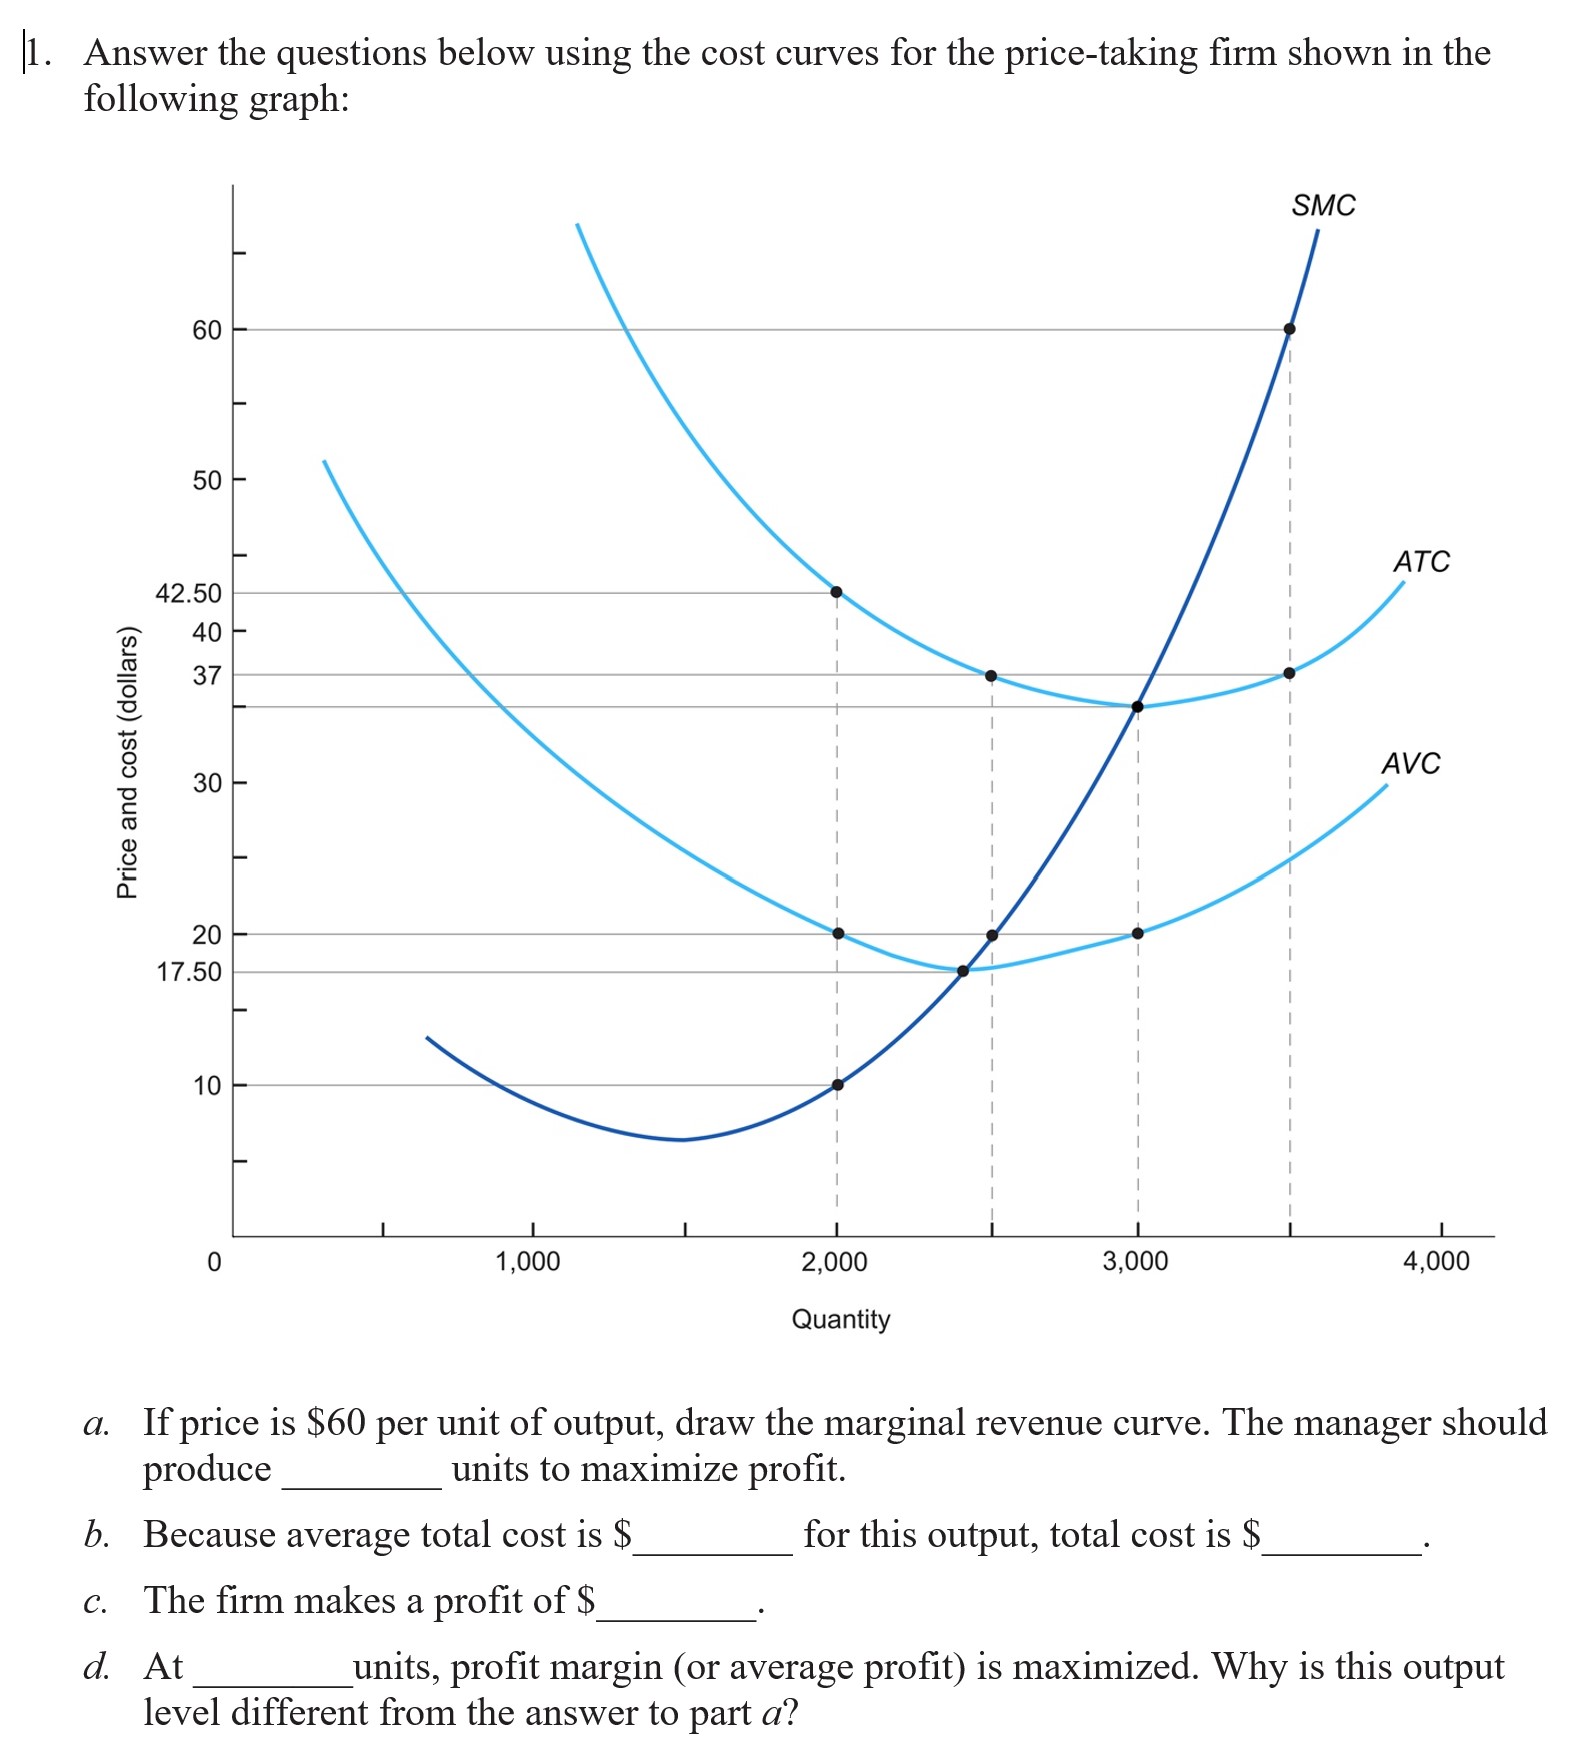
ll. Answer the questions below using the cost curves for the price-taking rm shown in the following graph: 60 50 42.50 00-h '40 w 0 Price and cost (dollars) 20 17.50 10 0 1.000 2,000 3,000 4,000 Quantity a. If price is $60 per unit of output, draw the marginal revenue curve. The manager should produce units to maximize prot. 1). Because average total cost is $ for this output, total cost is $ 0. The rm makes a prot of 35 d. At units, prot margin (or average prot) is maximized. Why is this output level different from the answer to part a
Step by Step Solution
There are 3 Steps involved in it
1 Expert Approved Answer
Step: 1 Unlock

Question Has Been Solved by an Expert!
Get step-by-step solutions from verified subject matter experts
Step: 2 Unlock
Step: 3 Unlock