

Question: LLower Control Limit (LCL-x) = inches B) Based on the x -chart the wire cutting process has been ( . ) C) Upper Control Limit
 LLower Control Limit (LCL-x) = inches
B) Based on the x-chart the wire cutting process has been ( . )
C)
Upper Control Limit ( UCLr) = ( . ) inches (round your response to three decimal places)
Lower Control Limit ( LCLr) =
based on the R-chart, the wire cutting process has been
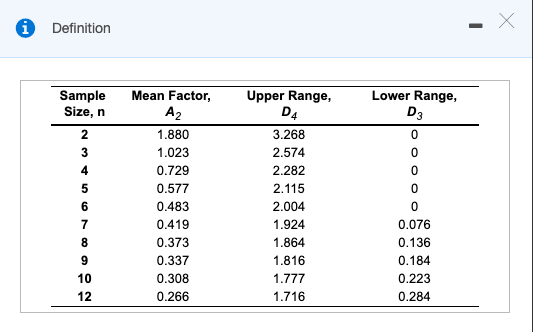
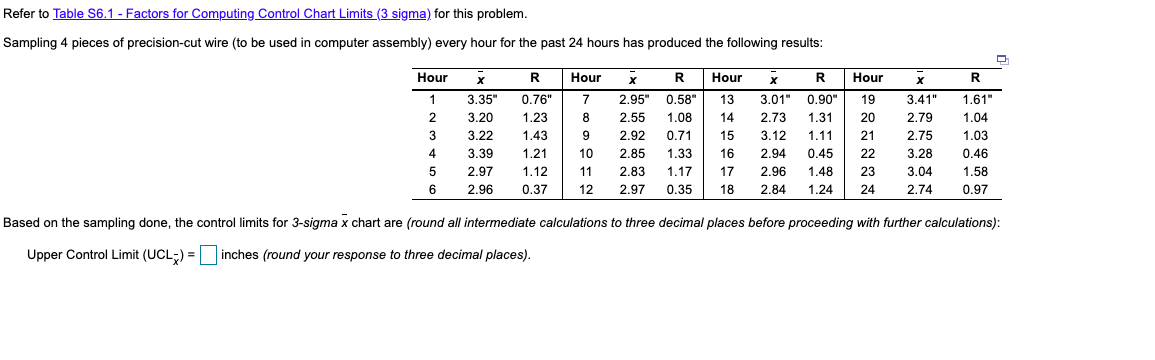
Refer to Table S6.1 - Factors for Computing Control Chart Limits (3 sigma) for this problem. Sampling 4 pieces of precision-cut wire (to be used in computer assembly) every hour for the past 24 hours has produced the following results: Hour 2 3.35" 3.20 3.22 3.39 2.97 2.96 R Hour 0.76" 1.238 1.43 1.21 10 1.12 11 0.37 12 2.95" 2.55 2.92 2.85 2.83 .97 R 0.58" 1.08 0.71 1.33 1.17 0.35 Hour x 133.01" 14 2.73 15 3.12 16 2.94 17 2.96 18 2.84 R 0.90" | 1.31 1.11 0.45 1.48 1.24 Hour X 19 3.41" 202.79 21 2.75 22 3 .28 23 3.04 24 2.74 R 1.61" 1.04 1.03 0.46 1.58 4 5 6 2 Based on the sampling done, the control limits for 3-sigmax chart are (round all intermediate calculations to three decimal places before proceeding with further calculations): Upper Control Limit (UCL) = inches (round your response to three decimal places). * Definition Upper Range, Lower Range, Sample Size, n D4 Mean Factor, A2 1.880 1.023 0.729 0.577 0.483 0.419 0.373 0.337 0.308 0.266 OOO 3.268 2.574 2.282 2.115 2.004 1.924 1.864 1.816 1.777 1.716 0.076 0.136 0.184 0.223 0.284
Step by Step Solution
There are 3 Steps involved in it
1 Expert Approved Answer
Step: 1 Unlock

Question Has Been Solved by an Expert!
Get step-by-step solutions from verified subject matter experts
Step: 2 Unlock
Step: 3 Unlock