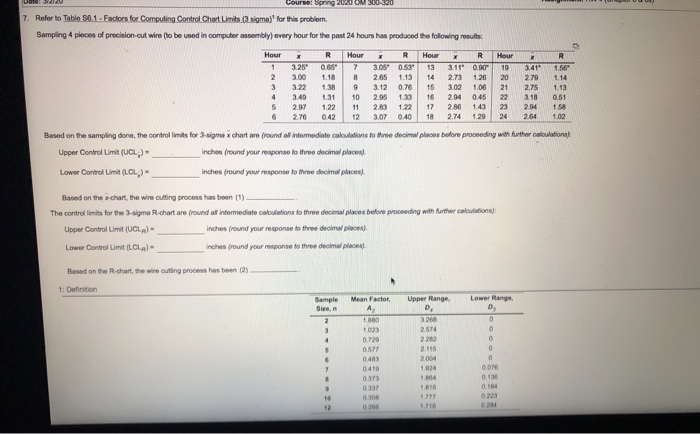
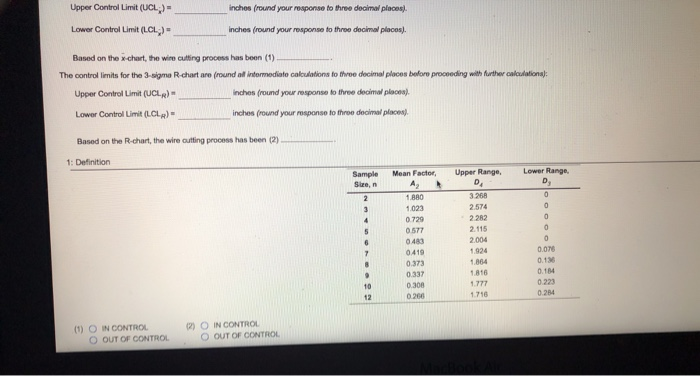
Question: Course: Spring 2000 OM 300-320 7. Rofer to Table 56.1 - Factors for Computing Control Chart Limits (3 sigma) for this problem. Sampling 4 pieces

Course: Spring 2000 OM 300-320 7. Rofer to Table
Course: Spring 2000 OM 300-320 7. Rofer to Table 56.1 - Factors for Computing Control Chart Limits (3 sigma) for this problem. Sampling 4 pieces of precision cut wire (to be used in computer assembly) every hour for the past 24 hours has produced the following results: Hour 3 4 5 6 R Hour X R Hour X R Hour X 3.25 0687 308 03 13 110 .00 19 341 3.001.18 2.65 1.1314 2.73 1.28 202 .79 3.22 13 3.12 0.76 15 302 1,06 21 2.75 3.49 131 10 205 130 16 204 0.45 22 3.18 297 1 22 11 23 122 17 2.86 143 23 2.94 2.78 0.42 12 307 0.40 18 274 129242 64 156 1.14 1.13 0.51 158 102 the c ulation Based on the sampling done, the control limits for 3 sigma Xchart are found all intermediato calculations to three decimal places before proceeding with Upper Control Limit (UCL) inches (round your response to three decimal places Lower Control Limit (LCL) - inches (round your response to three decimal places Based on the x-chart, the wire cutting process has been (1) The controllimits for the 3-sigma R-chart are found at intermediate calculations to three decimal places before proceeding with further calculations): Upper Control Limit (UCLR) - inches (round your response to three decimal places). Lower Control Limit (LCLR) inches (round your response to the decimal places) Based on the R-chart, the wire cuting process has been (2) - 1: Definition Sample Mean Factor Upper Range 2.115 0403 2004 0200 Inches fround your response to three decimal places). Upper Control Limit (UCL) - Lower Control Limit (LCL;) = inches fround your response to three decimal places) Based on the chart, the wire cutting process has been (1) The controllimits for the 3-sigma R.chart are found all intermediate calculations to three decimal places before proceeding with other collations Upper Control Limit(UCL) inches (round your response to three decimal local Lower Control Limit (LCLR) - inches fround your response to three decimal places Based on the R-chart, the wire cutting process has been (2) 1: Definition Sample Upper Range, Lower Range Mean Factor A 3.268 2.574 2282 2115 2.004 1023 0720 0577 0.483 0410 0.373 0337 0300 0.00 0.1 16 0223 (1) O IN CONTROL O OUT OF CONTROL O IN CONTROL OUT OF CONTROL

Step by Step Solution

There are 3 Steps involved in it

1 Expert Approved Answer
Step: 1 Unlock blur-text-image
Question Has Been Solved by an Expert!

Get step-by-step solutions from verified subject matter experts

Step: 2 Unlock
Step: 3 Unlock

Students Have Also Explored These Related General Management Questions!