

Question: Look at page 6 (High-Tech Statistics): Follow the steps explained in class and calculate the sales forecast for product Core in the High-Tech segment for
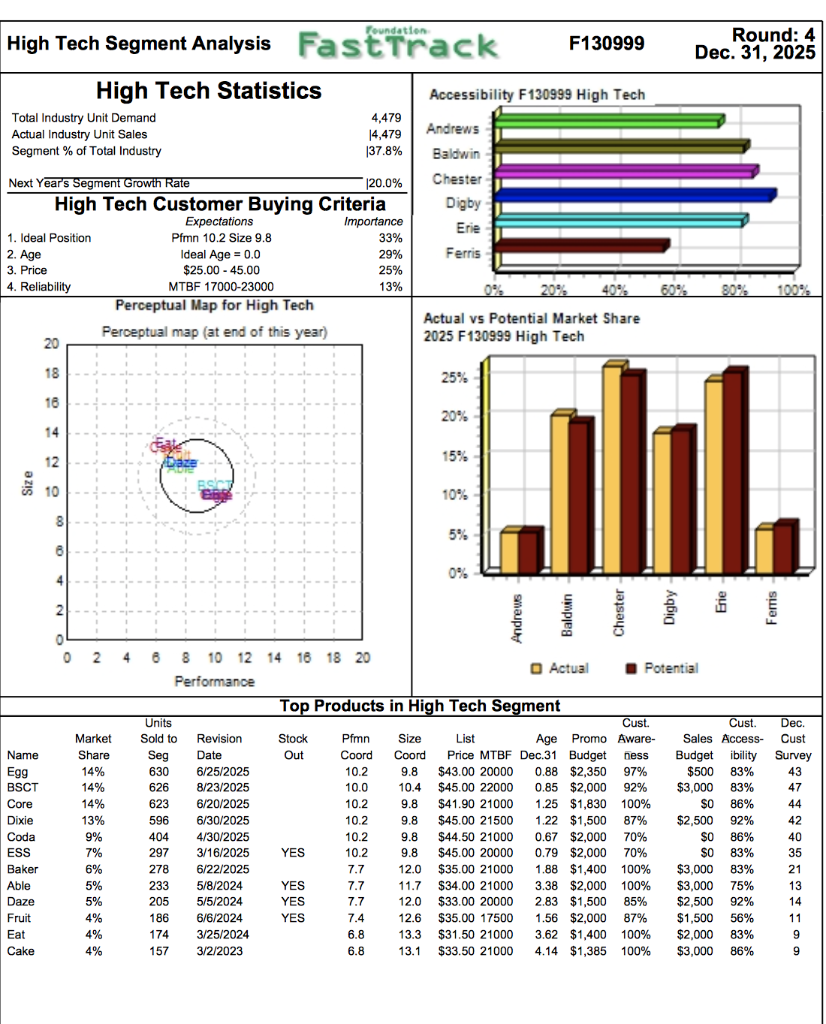 Look at page 6 (High-Tech Statistics): Follow the steps explained in class and calculate the sales forecast for product Core in the High-Tech segment for the next round, (round 5, year 2026); work with the best-case and worst-case scenarios (5 points).
Step by Step Solution
There are 3 Steps involved in it
1 Expert Approved Answer
Step: 1 Unlock

Question Has Been Solved by an Expert!
Get step-by-step solutions from verified subject matter experts
Step: 2 Unlock
Step: 3 Unlock