

Question: look at the table and graph below and write a short summary desciption of the dataset including data analysis, statistical outcome and results analaysis Cell
look at the table and graph below and write a short summary desciption of the dataset including data analysis, statistical outcome and results analaysis 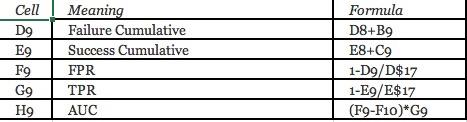
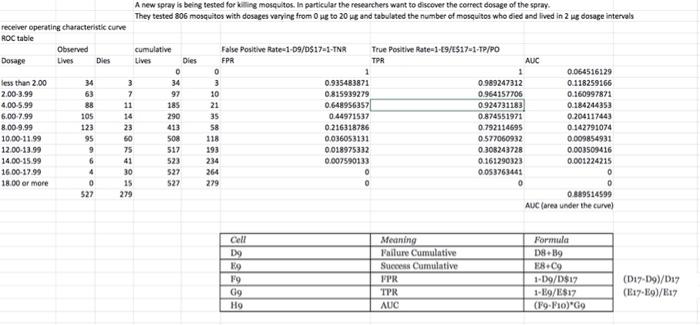
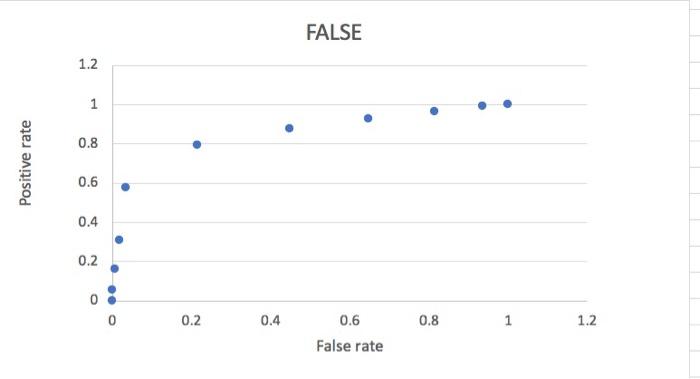
Cell D9 E9 F9 G9 H9 Meaning Failure Cumulative Success Cumulative FPR TPR AUC Formula D8+B9 E8+C9 1-D9/D$17 1-E9/E$17 (F9-F10)*G9 A new spray is being tested for killing mosquitos. In particular the researchers want to discover the correct dosage of the spray. They tested 806 mosquitos with dosages varying from Oug to 20 ug and tabulated the number of mosquitos who died and lived in 2 wg dosage intervals receiver operating characteristic curve ROC table Observed cumulative False Positive Rate-1-09/0$17-1-TNR True Positive Rate-1-19/$17-1-TP/PO Dosage Dies Lives Dies FPR TPR AUC 0 0 1 0.064516129 less than 2.00 34 3 34 3 0.935483871 0.989247312 0.118259166 2.00-3.99 63 7 97 10 0.815939279 0.964157706 0.160997871 4.00-5.99 88 11 185 21 0.648956357 0.924731183 0.184244353 6.00 7.99 105 14 290 35 0.44971537 0.874551971 0.204117443 8.00-9.99 123 23 413 58 0.216318786 0.792114695 0.142791074 10.00-11.99 95 50 SOS 118 0.036053131 0.577060932 0.009854931 12.00-13.99 9 75 517 193 0.018975312 0.308243728 0.003509416 14.00-15.99 6 41 523 234 0.007590133 0.161290323 0.001224215 16.00-17.99 4 30 264 0.053763441 0 18.00 or more 0 15 527 279 O 0 0 527 279 0.889514599 AUC area under the curve) 522 LILLIE Cell DO E9 FO 69 Meaning Failure Cumulative Success Cumulative PPR TPR AUC Formula 08.39 E8C9 1-09/D$17 1-Eo/E$12 (F9-F10)"Go (D17.09)/D17 (B17-E9)/17 FALSE 1.2 1 1 0.8 Positive rate 0.6 0.4 0.2 0 0 0.2 0.4 0.8 1 1.2 0.6 False rate Cell D9 E9 F9 G9 H9 Meaning Failure Cumulative Success Cumulative FPR TPR AUC Formula D8+B9 E8+C9 1-D9/D$17 1-E9/E$17 (F9-F10)*G9 A new spray is being tested for killing mosquitos. In particular the researchers want to discover the correct dosage of the spray. They tested 806 mosquitos with dosages varying from Oug to 20 ug and tabulated the number of mosquitos who died and lived in 2 wg dosage intervals receiver operating characteristic curve ROC table Observed cumulative False Positive Rate-1-09/0$17-1-TNR True Positive Rate-1-19/$17-1-TP/PO Dosage Dies Lives Dies FPR TPR AUC 0 0 1 0.064516129 less than 2.00 34 3 34 3 0.935483871 0.989247312 0.118259166 2.00-3.99 63 7 97 10 0.815939279 0.964157706 0.160997871 4.00-5.99 88 11 185 21 0.648956357 0.924731183 0.184244353 6.00 7.99 105 14 290 35 0.44971537 0.874551971 0.204117443 8.00-9.99 123 23 413 58 0.216318786 0.792114695 0.142791074 10.00-11.99 95 50 SOS 118 0.036053131 0.577060932 0.009854931 12.00-13.99 9 75 517 193 0.018975312 0.308243728 0.003509416 14.00-15.99 6 41 523 234 0.007590133 0.161290323 0.001224215 16.00-17.99 4 30 264 0.053763441 0 18.00 or more 0 15 527 279 O 0 0 527 279 0.889514599 AUC area under the curve) 522 LILLIE Cell DO E9 FO 69 Meaning Failure Cumulative Success Cumulative PPR TPR AUC Formula 08.39 E8C9 1-09/D$17 1-Eo/E$12 (F9-F10)"Go (D17.09)/D17 (B17-E9)/17 FALSE 1.2 1 1 0.8 Positive rate 0.6 0.4 0.2 0 0 0.2 0.4 0.8 1 1.2 0.6 False rate Step by Step Solution
There are 3 Steps involved in it
1 Expert Approved Answer
Step: 1 Unlock

Question Has Been Solved by an Expert!
Get step-by-step solutions from verified subject matter experts
Step: 2 Unlock
Step: 3 Unlock