

Question: look like this - ( R programming ) # Read in the homes.csv file homes - # Your code here # Use tapply ( )
look like this R programming
# Read in the homes.csv file
homes # Your code here
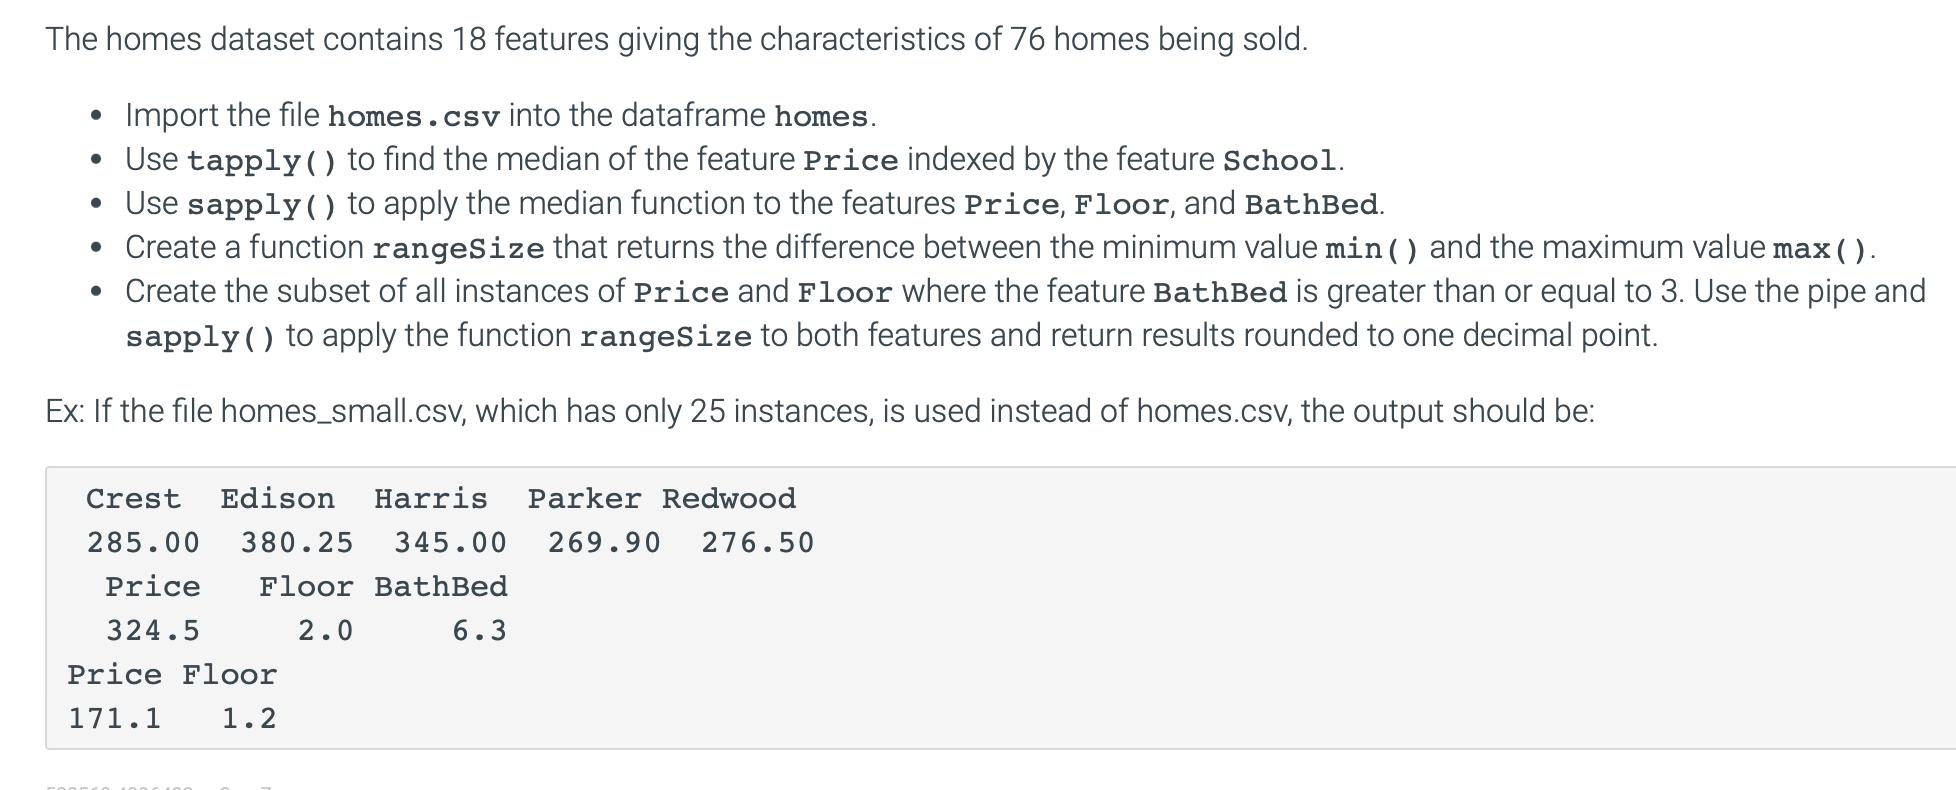
# Use tapply to find the median of the feature Price indexed by the feature School
tapplyMedian # Your code here
tapplyMedian
# Use sapply to apply the median function to the features Price, Floor, and BathBed
sapplyMedian # Your code here
sapplyMedian
# Create a function rangeSize that returns the difference between the minimum value min and
# the maximum value max
rangeSize # Your code here
# Create the subset of all instances of Price and Floor where the feature BathBed is greater than or equal to
# Use the pipe and sapply to apply the function rangeSize to both features and
# return results rounded to one decimal point
# Your code here
there is no datasheet, this is lab example work to learn how to do minmum and maximum R code programing and other R code programing. Just read screenshot and here's code list here what it needs to do that's all.
Step by Step Solution
There are 3 Steps involved in it
1 Expert Approved Answer
Step: 1 Unlock

Question Has Been Solved by an Expert!
Get step-by-step solutions from verified subject matter experts
Step: 2 Unlock
Step: 3 Unlock