

Question: looking for experts in computer architecture to answer this problem Exploring Instruction Flow and and Instruction level parallelism ILP Consider the following pseudo-assembly code. Top:
looking for experts in computer architecture to answer this problem
Exploring Instruction Flow and and Instruction level parallelism
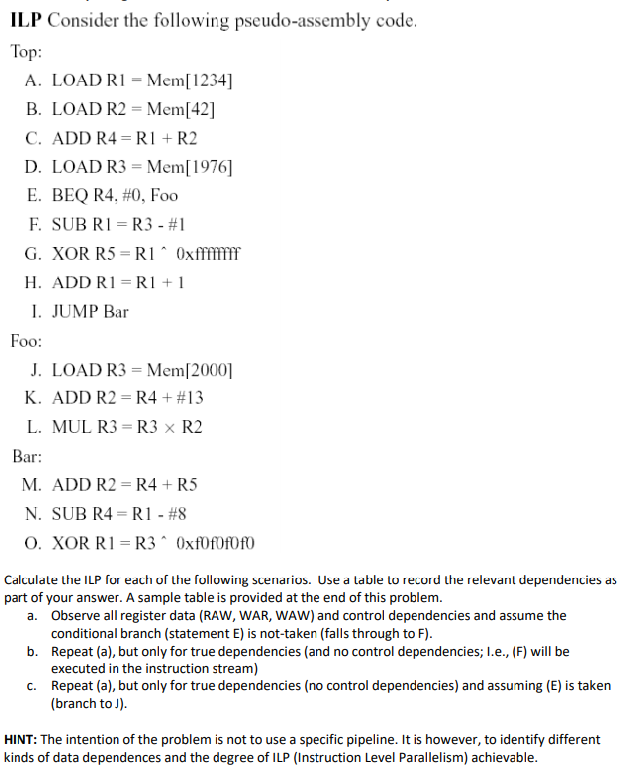
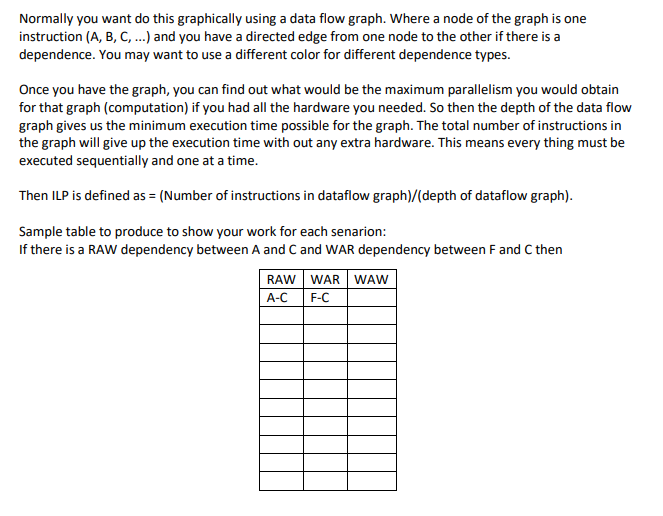
ILP Consider the following pseudo-assembly code. Top: A. LOAD RI - Mem[1234] B. LOAD R2 = Mem[42] C. ADD R4=R1 + R2 D. LOAD R3 = Mem[1976] E. BEQ R4, #0, Foo F. SUB R1 = R3 - #1 G. XOR R5=R1Oxfffiff H. ADD R1 = R1 +1 I. JUMP Bar Foo: J. LOAD R3 = Mem[2000] K. ADD R2 = R4 + #13 L. MUL R3 = R3 x R2 Bar: M. ADD R2=R4+R5 N. SUB R4=R1 - #8 0. XOR R1 = R3^ Oxf0f0f0f0 Calculate the ILP for each of the following scenarios. Use a table to record the relevant dependencies as part of your answer. A sample table is provided at the end of this problem. a. Observe all register data (RAW, WAR, WAW) and control dependencies and assume the conditional branch (statement E) is not-taken (falls through to F). b. Repeat (a), but only for true dependencies (and no control dependencies; I.e., (F) will be executed in the instruction stream) C. Repeat (a), but only for true dependencies (no control dependencies) and assuming (E) is taken (branch to). HINT: The intention of the problem is not to use a specific pipeline. It is however, to identify different kinds of data dependences and the degree of ILP (Instruction Level Parallelism) achievable. Normally you want do this graphically using a data flow graph. Where a node of the graph is one instruction (A, B, C, ...) and you have a directed edge from one node to the other if there is a dependence. You may want to use a different color for different dependence types. Once you have the graph, you can find out what would be the maximum parallelism you would obtain for that graph (computation) if you had all the hardware you needed. So then the depth of the data flow graph gives us the minimum execution time possible for the graph. The total number of instructions in the graph will give up the execution time with out any extra hardware. This means every thing must be executed sequentially and one at a time. Then ILP is defined as = (Number of instructions in dataflow graph)/(depth of dataflow graph). Sample table to produce to show your work for each senarion: If there is a RAW dependency between A and C and WAR dependency between F and then WAW RAW A-C WAR F-C ILP Consider the following pseudo-assembly code. Top: A. LOAD RI - Mem[1234] B. LOAD R2 = Mem[42] C. ADD R4=R1 + R2 D. LOAD R3 = Mem[1976] E. BEQ R4, #0, Foo F. SUB R1 = R3 - #1 G. XOR R5=R1Oxfffiff H. ADD R1 = R1 +1 I. JUMP Bar Foo: J. LOAD R3 = Mem[2000] K. ADD R2 = R4 + #13 L. MUL R3 = R3 x R2 Bar: M. ADD R2=R4+R5 N. SUB R4=R1 - #8 0. XOR R1 = R3^ Oxf0f0f0f0 Calculate the ILP for each of the following scenarios. Use a table to record the relevant dependencies as part of your answer. A sample table is provided at the end of this problem. a. Observe all register data (RAW, WAR, WAW) and control dependencies and assume the conditional branch (statement E) is not-taken (falls through to F). b. Repeat (a), but only for true dependencies (and no control dependencies; I.e., (F) will be executed in the instruction stream) C. Repeat (a), but only for true dependencies (no control dependencies) and assuming (E) is taken (branch to). HINT: The intention of the problem is not to use a specific pipeline. It is however, to identify different kinds of data dependences and the degree of ILP (Instruction Level Parallelism) achievable. Normally you want do this graphically using a data flow graph. Where a node of the graph is one instruction (A, B, C, ...) and you have a directed edge from one node to the other if there is a dependence. You may want to use a different color for different dependence types. Once you have the graph, you can find out what would be the maximum parallelism you would obtain for that graph (computation) if you had all the hardware you needed. So then the depth of the data flow graph gives us the minimum execution time possible for the graph. The total number of instructions in the graph will give up the execution time with out any extra hardware. This means every thing must be executed sequentially and one at a time. Then ILP is defined as = (Number of instructions in dataflow graph)/(depth of dataflow graph). Sample table to produce to show your work for each senarion: If there is a RAW dependency between A and C and WAR dependency between F and then WAW RAW A-C WAR F-C
Step by Step Solution
There are 3 Steps involved in it

Get step-by-step solutions from verified subject matter experts