

Question: Looking for recommendations on simulation CAPSIMOps SimID: OP95740_1 Round: 1 (2021) R&D Marketing Production Finance Reports - Alerts o File O Research & Development Products
Looking for recommendations on simulation
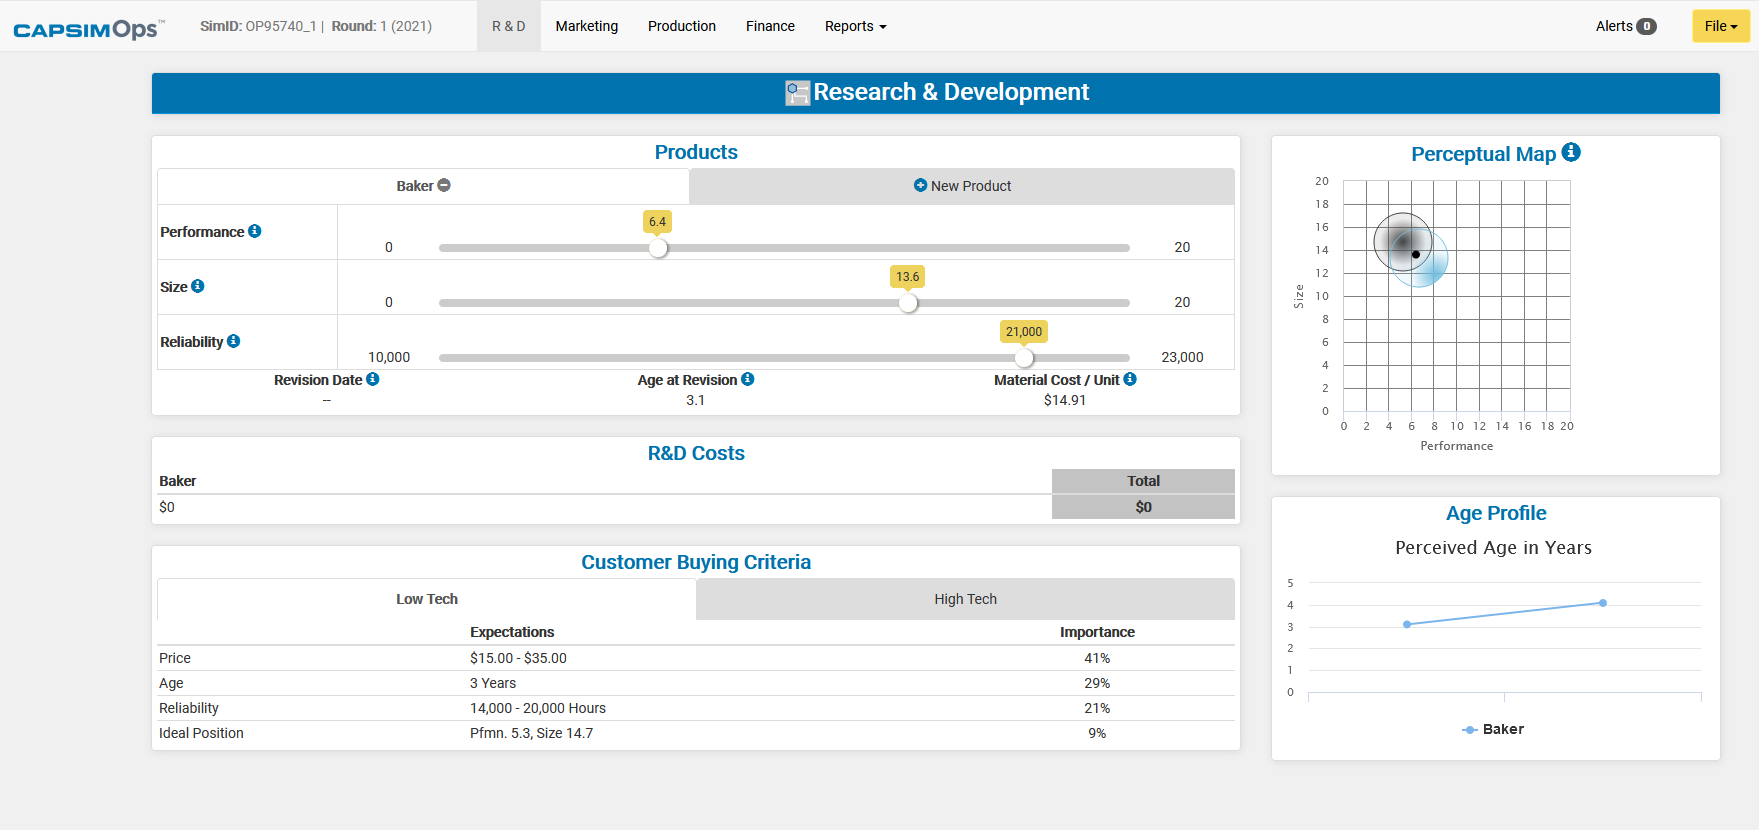
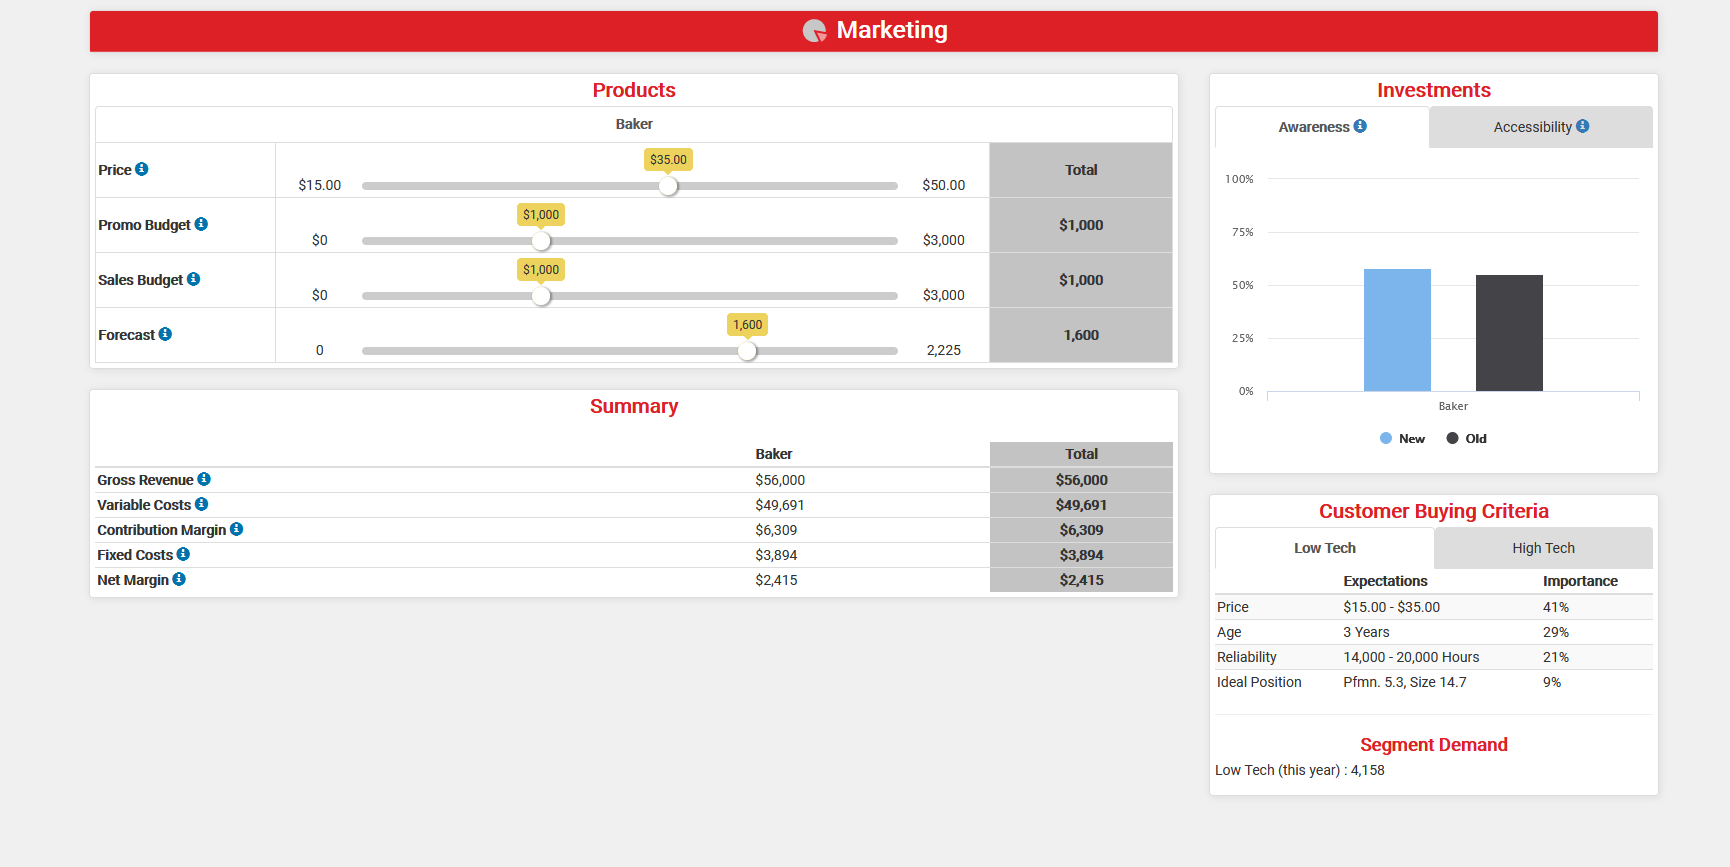
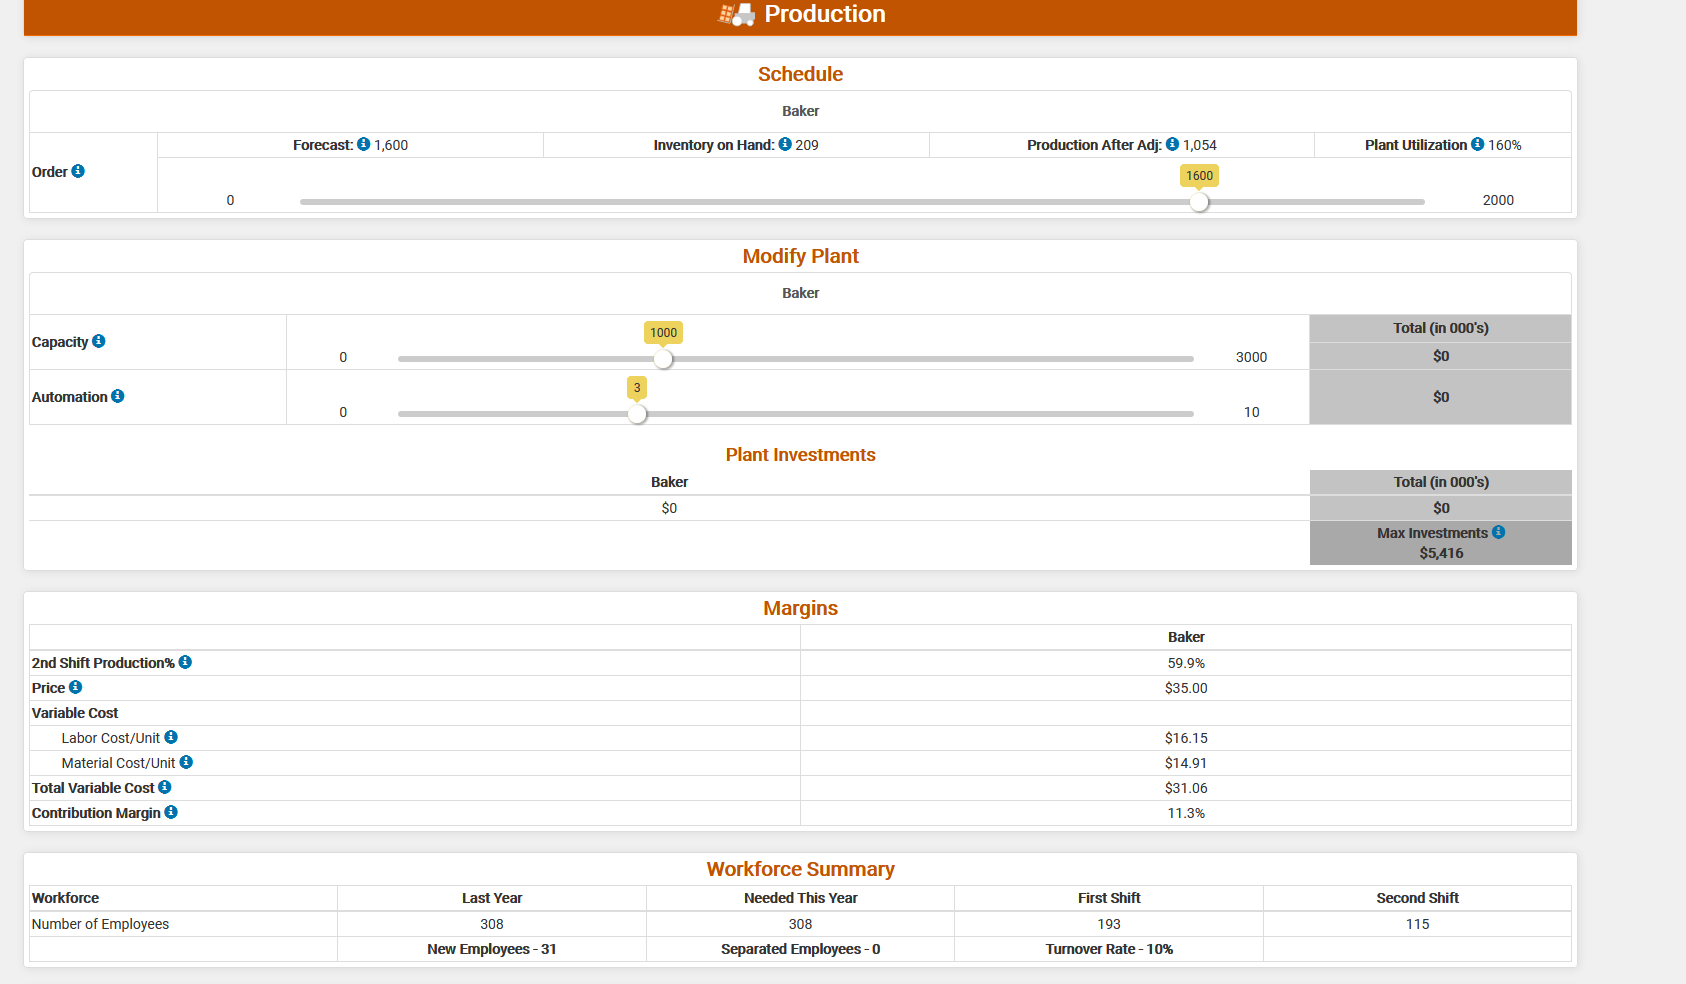
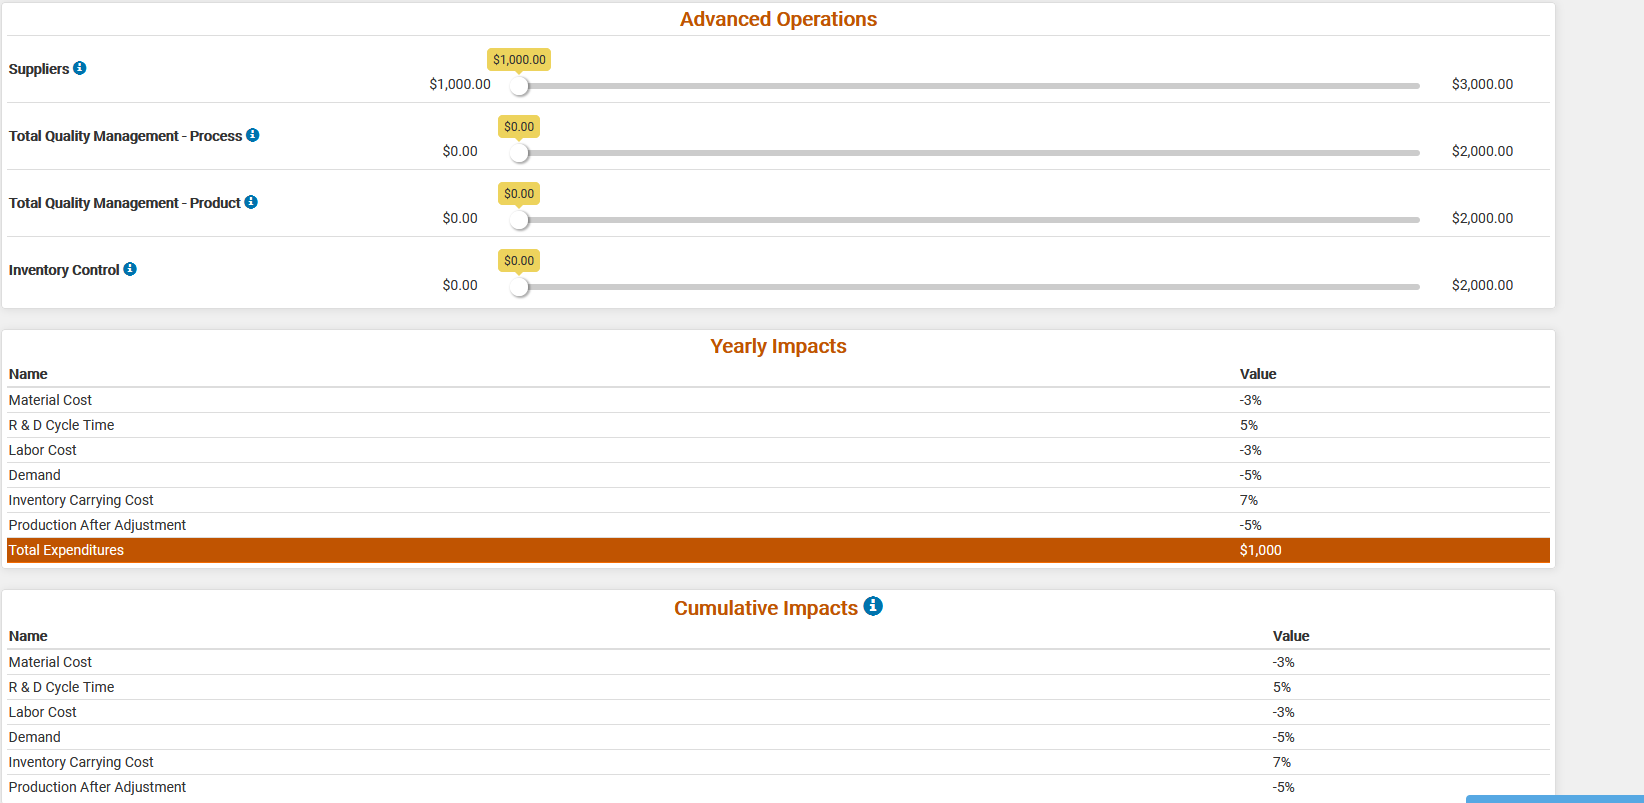
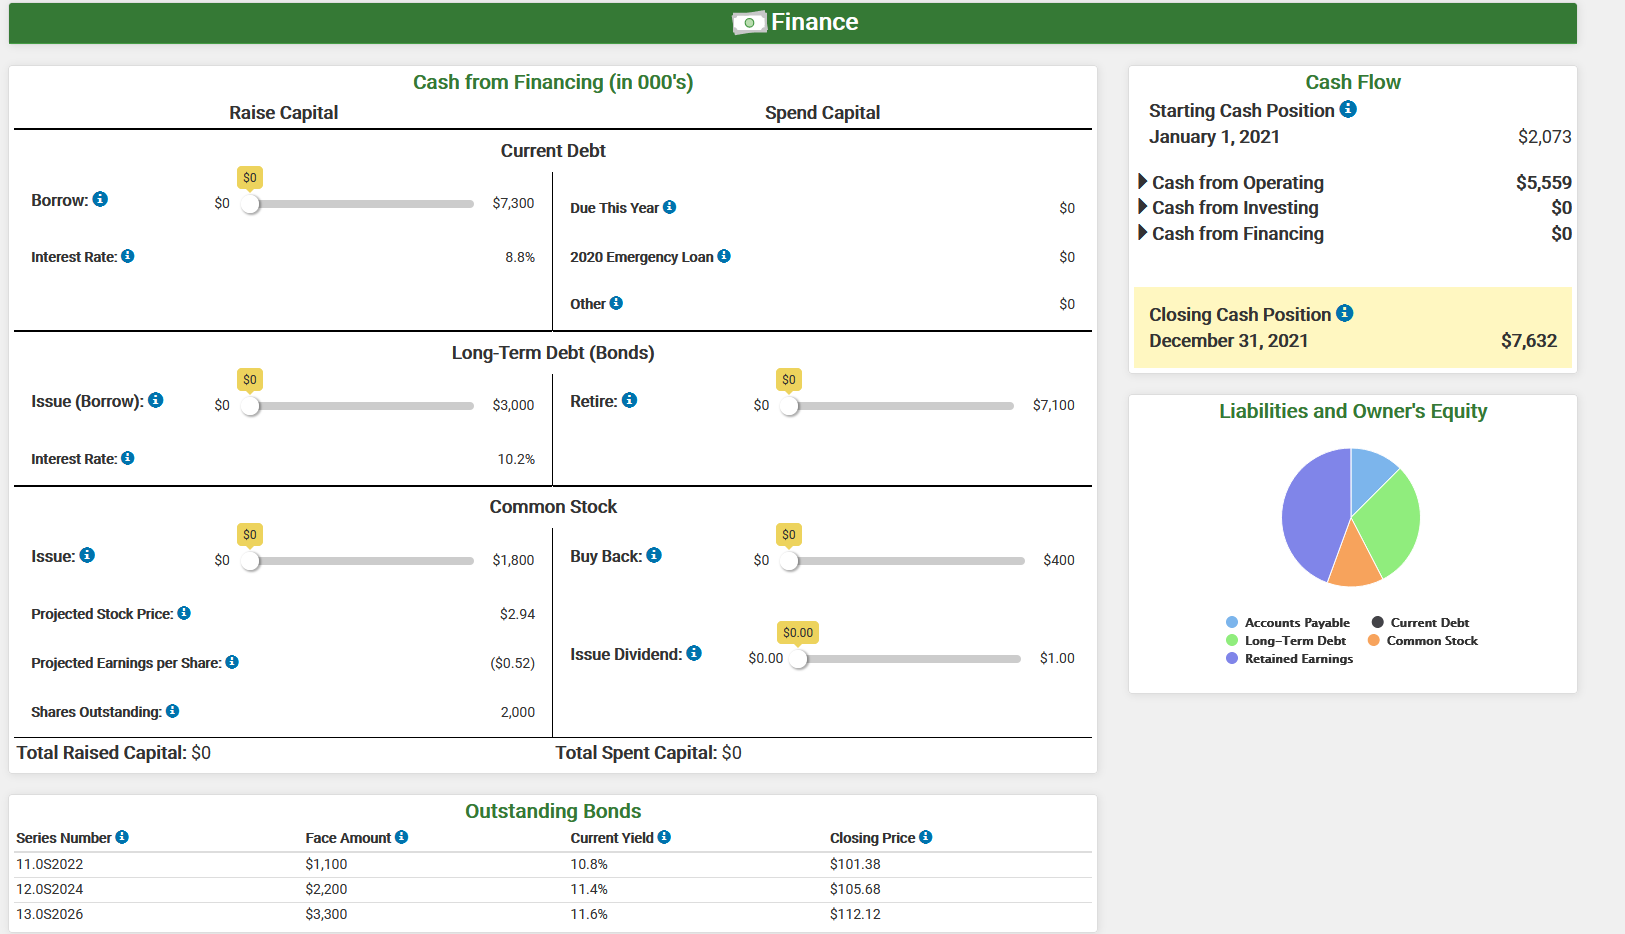
CAPSIMOps SimID: OP95740_1 Round: 1 (2021) R&D Marketing Production Finance Reports - Alerts o File O Research & Development Products Perceptual Map Baker New Product 20 18 6.4 Performance 16 0 20 14 13.6 Size 12 N 10 0 20 8 21,000 Reliability 6 23,000 10,000 Revision Date 0 4 Age at Revision 3.1 Material Cost / Unit $14.91 2 0 0 2 4 6 8 10 12 14 16 18 20 Performance R&D Costs Baker Total $0 $0 Age Profile Perceived Age in Years Customer Buying Criteria 5 Low Tech High Tech 4 3 Expectations $15.00 - $35.00 Importance 41% 2 Price 1 Age 3 Years 29% 0 21% Reliability Ideal Position 14,000 - 20,000 Hours Pfmn. 5.3, Size 14.7 9% + Baker Marketing Products Investments Baker Awareness Accessibility $35.00 Price Total 100% $15.00 $50.00 $1,000 Promo Budget $1,000 75% $0 $3,000 $1,000 Sales Budget $1,000 50% $0 $3,000 1,600 Forecast 1,600 25% 0 2,225 0% Summary Baker New Old Baker Total Gross Revenue a Variable Costs Contribution Margin Fixed Costs Net Margin Customer Buying Criteria $56,000 $49,691 $6,309 $3,894 $2,415 $56,000 $49,691 $6,309 Low Tech High Tech $3,894 $2,415 Importance 41% Price Expectations $15.00 - $35.00 3 Years 14,000 - 20,000 Hours Pfmn. 5.3, Size 14.7 Age Reliability Ideal Position 29% 21% 9% Segment Demand Low Tech (this year): 4,158 ... Production Schedule Baker Forecast: 1,600 Inventory on Hand: 209 Production After Adj: 1,054 Plant Utilization 160% Order 1600 0 2000 Modify Plant Baker 1000 Total (in 000's) Capacity 0 3000 SO Automation $0 0 10 Plant Investments Baker SO Total (in 000's) $0 Max Investments $5,416 Margins Baker 59.9% $35.00 2nd Shift Production% Price Variable Cost Labor Cost/Unit Material Cost/Unit Total Variable Cost Contribution Margine $16.15 $14.91 $31.06 11.3% Workforce Summary Needed This Year Last Year First Shift Second Shift Workforce Number of Employees 308 308 193 115 New Employees - 31 Separated Employees - 0 Turnover Rate - 10% Advanced Operations $1,000.00 Suppliers $1,000.00 $3,000.00 $0.00 Total Quality Management - Process $0.00 $2,000.00 $0.00 Total Quality Management - Product $0.00 $2,000.00 $0.00 Inventory Control $0.00 $2,000.00 Yearly Impacts Name Value -3% 5% Material Cost R & D Cycle Time Labor Cost Demand Inventory Carrying Cost Production After Adjustment Total Expenditures -3% -5% 7% -5% $1,000 Cumulative Impacts Name Value Material Cost -3% 5% -3% R&D Cycle Time Labor Cost Demand Inventory Carrying Cost Production After Adjustment -5% 7% -5% o Finance Cash from Financing (in 000's) Raise Capital Spend Capital Cash Flow Starting Cash Position January 1, 2021 $2,073 Current Debt $0 Borrow: 0 $0 $7,300 Due This Year $0 Cash from Operating Cash from Investing Cash from Financing $5,559 $0 $0 Interest Rate: 8.8% 2020 Emergency Loan $0 Other @ $0 Closing Cash Position December 31, 2021 $7,632 Long-Term Debt (Bonds) $0 $0 Issue (Borrow): 0 $0 $3,000 Retire: 0 $0 $7,100 Liabilities and Owner's Equity Interest Rate: 0 10.2% Common Stock $0 $0 Issue: 0 $0 $1,800 Buy Back: $0 $400 Projected Stock Price: $2.94 $0.00 Accounts Payable Long-Term Debt Retained Earnings Current Debt Common Stock Issue Dividend: 0 ($0.52) $0.00 Projected Earnings per Share: $1.00 Shares Outstanding: 2,000 Total Raised Capital: $0 Total Spent Capital: $0 Outstanding Bonds Current Yield Series Number Face Amount 11.082022 10.8% Closing Price $101.38 $105.68 $1,100 $2,200 $3,300 12.0S2024 11.4% 13.0S2026 11.6% $112.12 CAPSIMOps SimID: OP95740_1 Round: 1 (2021) R&D Marketing Production Finance Reports - Alerts o File O Research & Development Products Perceptual Map Baker New Product 20 18 6.4 Performance 16 0 20 14 13.6 Size 12 N 10 0 20 8 21,000 Reliability 6 23,000 10,000 Revision Date 0 4 Age at Revision 3.1 Material Cost / Unit $14.91 2 0 0 2 4 6 8 10 12 14 16 18 20 Performance R&D Costs Baker Total $0 $0 Age Profile Perceived Age in Years Customer Buying Criteria 5 Low Tech High Tech 4 3 Expectations $15.00 - $35.00 Importance 41% 2 Price 1 Age 3 Years 29% 0 21% Reliability Ideal Position 14,000 - 20,000 Hours Pfmn. 5.3, Size 14.7 9% + Baker Marketing Products Investments Baker Awareness Accessibility $35.00 Price Total 100% $15.00 $50.00 $1,000 Promo Budget $1,000 75% $0 $3,000 $1,000 Sales Budget $1,000 50% $0 $3,000 1,600 Forecast 1,600 25% 0 2,225 0% Summary Baker New Old Baker Total Gross Revenue a Variable Costs Contribution Margin Fixed Costs Net Margin Customer Buying Criteria $56,000 $49,691 $6,309 $3,894 $2,415 $56,000 $49,691 $6,309 Low Tech High Tech $3,894 $2,415 Importance 41% Price Expectations $15.00 - $35.00 3 Years 14,000 - 20,000 Hours Pfmn. 5.3, Size 14.7 Age Reliability Ideal Position 29% 21% 9% Segment Demand Low Tech (this year): 4,158 ... Production Schedule Baker Forecast: 1,600 Inventory on Hand: 209 Production After Adj: 1,054 Plant Utilization 160% Order 1600 0 2000 Modify Plant Baker 1000 Total (in 000's) Capacity 0 3000 SO Automation $0 0 10 Plant Investments Baker SO Total (in 000's) $0 Max Investments $5,416 Margins Baker 59.9% $35.00 2nd Shift Production% Price Variable Cost Labor Cost/Unit Material Cost/Unit Total Variable Cost Contribution Margine $16.15 $14.91 $31.06 11.3% Workforce Summary Needed This Year Last Year First Shift Second Shift Workforce Number of Employees 308 308 193 115 New Employees - 31 Separated Employees - 0 Turnover Rate - 10% Advanced Operations $1,000.00 Suppliers $1,000.00 $3,000.00 $0.00 Total Quality Management - Process $0.00 $2,000.00 $0.00 Total Quality Management - Product $0.00 $2,000.00 $0.00 Inventory Control $0.00 $2,000.00 Yearly Impacts Name Value -3% 5% Material Cost R & D Cycle Time Labor Cost Demand Inventory Carrying Cost Production After Adjustment Total Expenditures -3% -5% 7% -5% $1,000 Cumulative Impacts Name Value Material Cost -3% 5% -3% R&D Cycle Time Labor Cost Demand Inventory Carrying Cost Production After Adjustment -5% 7% -5% o Finance Cash from Financing (in 000's) Raise Capital Spend Capital Cash Flow Starting Cash Position January 1, 2021 $2,073 Current Debt $0 Borrow: 0 $0 $7,300 Due This Year $0 Cash from Operating Cash from Investing Cash from Financing $5,559 $0 $0 Interest Rate: 8.8% 2020 Emergency Loan $0 Other @ $0 Closing Cash Position December 31, 2021 $7,632 Long-Term Debt (Bonds) $0 $0 Issue (Borrow): 0 $0 $3,000 Retire: 0 $0 $7,100 Liabilities and Owner's Equity Interest Rate: 0 10.2% Common Stock $0 $0 Issue: 0 $0 $1,800 Buy Back: $0 $400 Projected Stock Price: $2.94 $0.00 Accounts Payable Long-Term Debt Retained Earnings Current Debt Common Stock Issue Dividend: 0 ($0.52) $0.00 Projected Earnings per Share: $1.00 Shares Outstanding: 2,000 Total Raised Capital: $0 Total Spent Capital: $0 Outstanding Bonds Current Yield Series Number Face Amount 11.082022 10.8% Closing Price $101.38 $105.68 $1,100 $2,200 $3,300 12.0S2024 11.4% 13.0S2026 11.6% $112.12
Step by Step Solution
There are 3 Steps involved in it
1 Expert Approved Answer
Step: 1 Unlock

Question Has Been Solved by an Expert!
Get step-by-step solutions from verified subject matter experts
Step: 2 Unlock
Step: 3 Unlock