

Question: I need help with Capsim Round 3 R&D, Marketing, Production, Finance? Based on my decisions from Round 1 & Round 2 Recalculate ein Research &
I need help with Capsim Round 3 R&D, Marketing, Production, Finance? Based on my decisions from Round 1 & Round 2
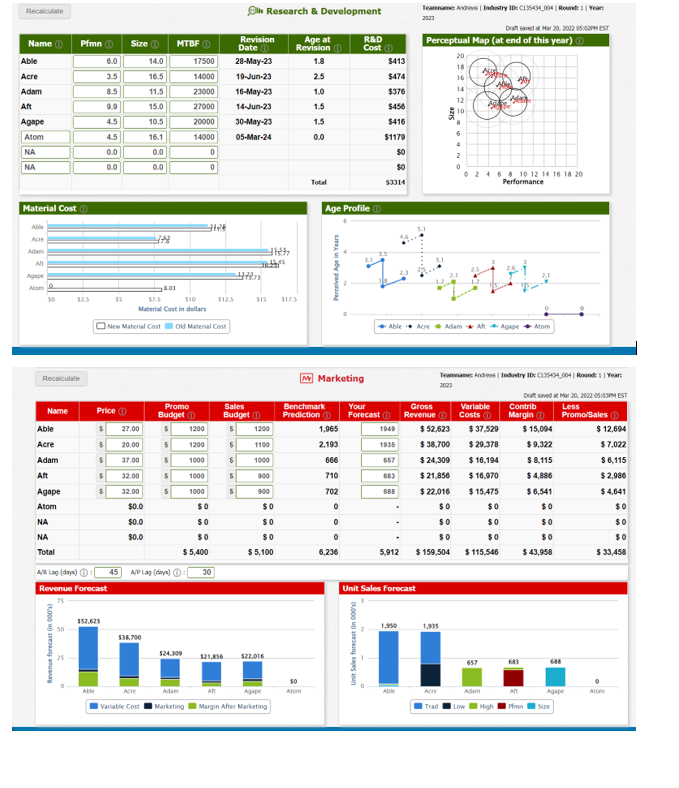
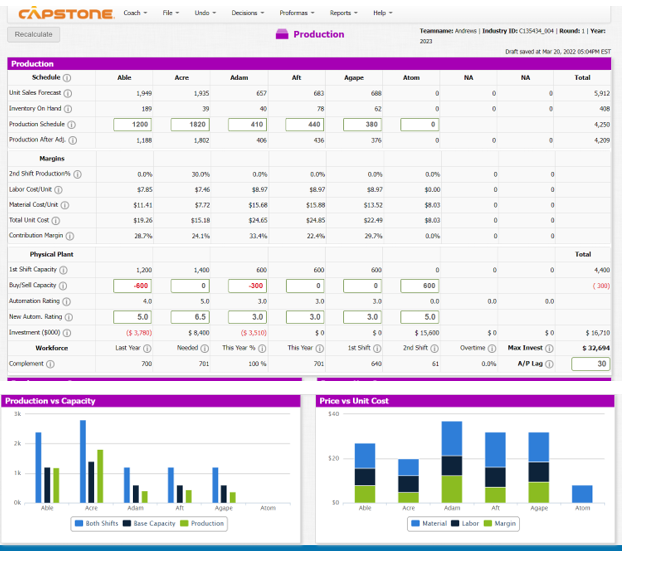
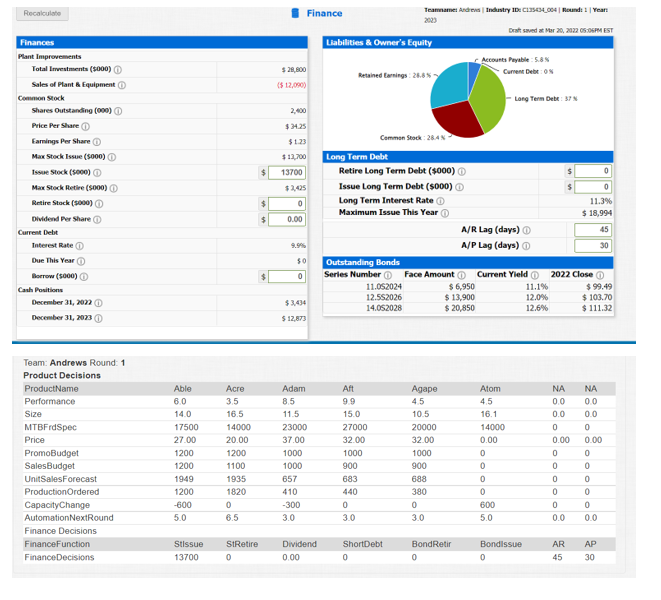
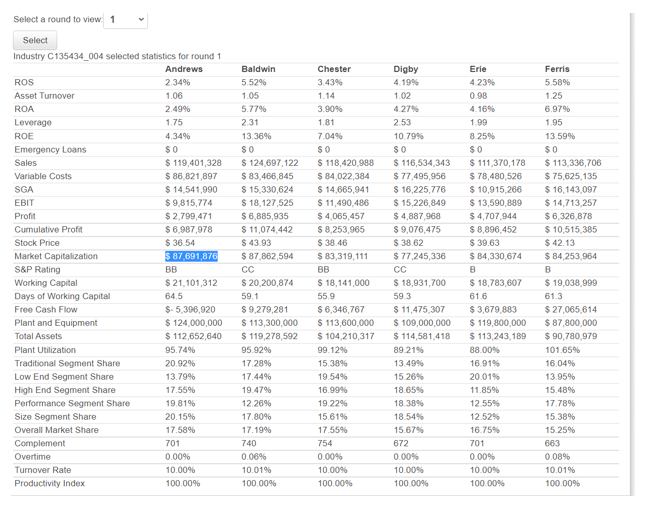
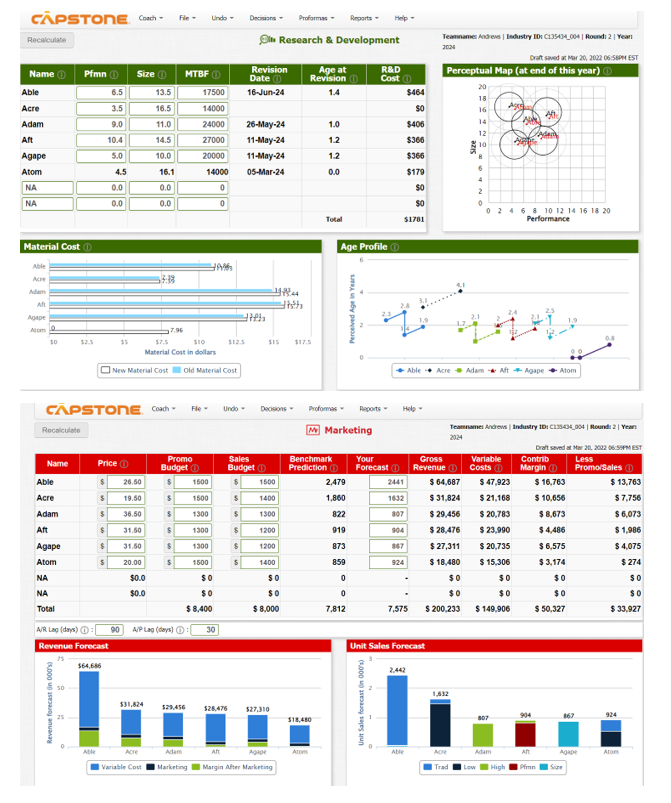
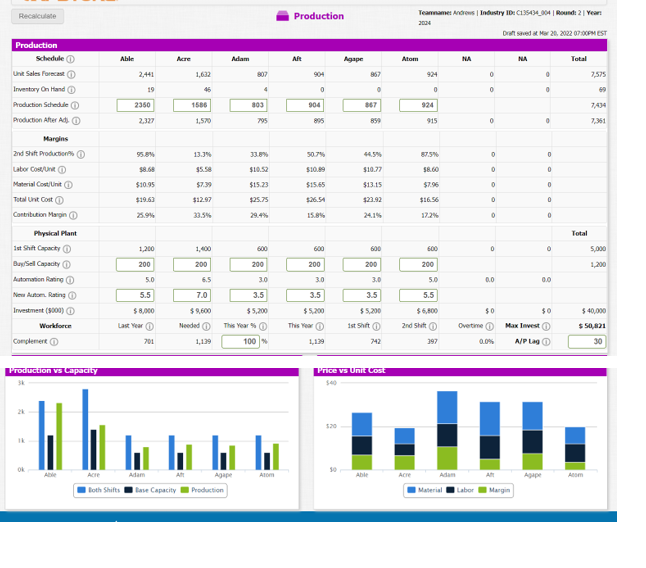
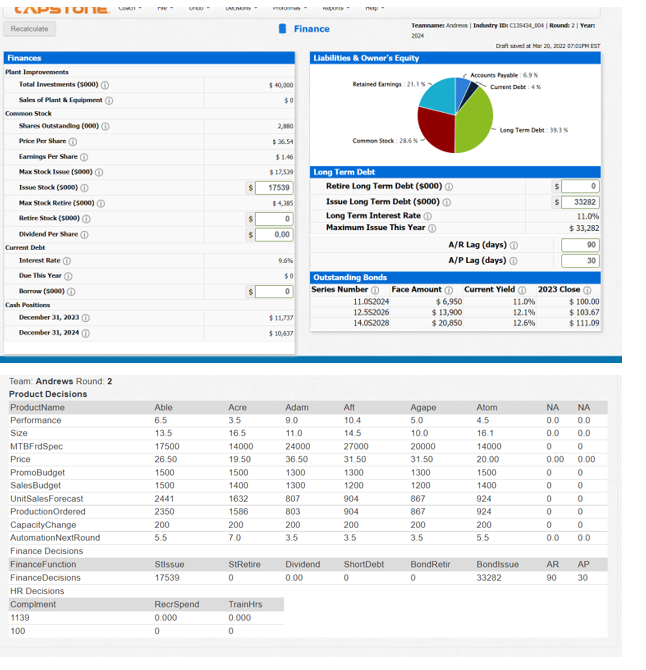
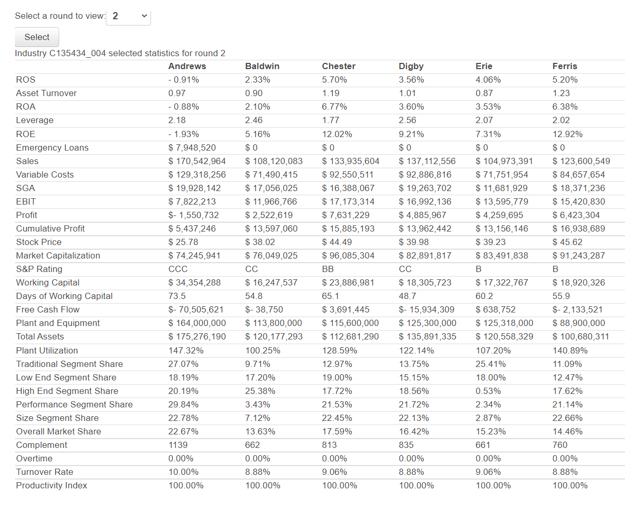
Recalculate ein Research & Development Pimn Name Able Size 14.0 16.5 6.0 Acre MTBF 17500 14000 23000 27000 20000 3.5 8.5 Teantrame Andrews Industry ID: C13543_004 Round 1 Year: 2023 Draft SevedaMar 20, 2022 05.02PM EST Perceptual Map (at end of this year) 20 18 ALES 16 14 12 Revision Date 28-May-23 19-Jun-23 16-May-23 14-Jun-23 30-May-23 05-Mar-24 R&D Cost $413 $474 $376 $456 11.5 Age at Revision 1.8 25 1.0 1.5 1.5 0.0 Adam Aft Agape Atom NA NA 9.9 15.0 10.5 6 4.5 4.5 0.0 14000 16.1 0.0 0 0 $416 $1179 50 $0 53314 0.0 0.0 S 2 0 0 2 4 6 8 10 12 14 16 18 20 Performance Total Material Cost Age Profile Acre HA ALL Agape Acom Neceived Age in Years Lite 2 TO 501 510 Material Cost in dollars 512.5 517.5 New Material Cost Old Material Cost Able . Acre Adam Aft - Agape Atom Recalculate Marketing Name Price Promo Budget 1200 Sales Budget Your Forecast 1949 27,00 Benchmark Prediction 1,965 2,193 1200 $ $ 1200 $ 1100 1935 Able Acre Adam Aft 20.00 37.00 $ $ 1000 $ 1000 666 Teammes Andres Industry IDC135434_004 Rount: 1 Year: 2003 Dat saved Mar 20, 2022 05:00PM EST Gross Variable Contrib Less Revenue Costs Margin PromoSales $ 52,623 $ 37.520 $ 15,094 $ 12,694 $38.700 $ 29,378 $ 9,322 $7.022 $ 24,309 $ 16,194 $ 8.115 $ 6,115 $ 21,856 $ 16,970 $ 4,886 $2.986 $ 22,016 $15.475 $ 6,541 $4,641 $0 $0 $0 $0 SO SO $0 $0 $0 $0 $0 $0 $ 159,504 $ 115,546 $ 43,958 $33,458 $ $ 1000 s 900 32.00 32.00 657 683 688 710 702 s $ S 900 Agape Atom $0.0 $0 0 NA 1000 $0 $0 $0 $5,400 SO $0.0 $0.0 0 NA 0 $0 $ 5,100 Total 6,236 5,912 AP Lady 30 A/R Lag (day) Revenue Forecast Unit Sales Forecast 552.623 1,950 1,935 538,700 Revenue forecast on 000) Unit Sales forecast on 000's 524,309 321,656 522,016 657 683 688 50 Atom Abe ACH AR Agape A Agape Variable Cost Marketing AN Pfm Margin After Marketing Trad Size CAPSTONE Coach - File- Unde - Decision- Proformas - Reports Help Recalculate Production Team name: Andres Industry ID: C135434_304 Round: 1 Year: 2023 Daftsaved at 20, 2002 05:00PM EST Able Acre Adam AR Agape Atom NA NA Total 1,949 1.935 O 0 5,912 Production Schedule Une Sales Forecast Inventory On Hand Production Schedule Production After Ads 30 40 62 O 0 408 189 1200 78 440 410 380 i 0 4.250 1820 1,802 1,186 436 376 0 4,209 0.0% 30.0% 0.0% 0.0% 0.0% 0.0% 0 0 $7.85 $7.46 SELS $8.97 $8.97 $0.00 0 0 $11.41 57.72 $15.60 $15.88 $9.03 0 0 51352 $22.45 $19.26 $15.18 0 0 $24.65 21.4% 2017 24.14 229.24 0.0 0 Total Margins 2nd Shift Production Labor Cost/Unit Material Costunut Total Unit Cost Contribution Margin Physical Plant 1st Shirt Capacity BuySell Capachy Automation Rating New Autom. Rating Investment (5000) Workforce Complement 1,200 1,400 600 600 600 0 0 0 -600 0 300 0 0 600 (300) 40 5.0 20 3.0 0.0 0.0 0.0 5.0 6.5 3.0 3.0 5.0 $ 3.780) $8.400 3.0 53.510) This year 50 $0 $ 15,600 $0 50 $56.710 Last Your Needed Ist hit 2nd St Max Invest $32,694 This year 201 Overtime 0.0% 200 701 2005 610 61 A/P Lago 30 Production vs Capacity sk Price vs Unit Cost 540 520 1k to be HO OK 50 Able ACHE Adam AT ATO Acre AN Alom Production Both Shis Base Capacity Material Labor Margin Recalculate Finance Teamname: Andres Industry ID. CIASCL_004 Round: 1 year 2023 Drat saved Mar 20, 2122 05:06PM EST Liabilities & Owner's Equity Accounts Payable : 5.85 $ 28,800 Retained Earnings 2685 Current Debtos $12,090) - Long Term Debt: 37 2.000 Finances Plant Improvements Total Investments (5000) Sales of Plant Equipment Common Stock Shares Outstanding (000) Price Per Share Earnings Per Share Max Stock Issue (5000) Issue Stock (5000) Max Stock Retire (5000) Retire Stock (5000) Dividend Per Share Current Debit Interest Rate Due This Year Borrow (5000) Cash Position December 31, 2022 December 31, 2013 $24.25 $123 $ 12,700 13700 $2.405 0 O $ $ 0.00 Commen Stock: 28 Long Term Debt Retire Long Term Debt ($000) O Issue Long Term Debt (5000) Long Term Interest Rate 11.3% Maximum Issue This Year $ 18,994 A/R Lag (days) 45 A/P Lag (days) 30 Outstanding Bonds Series Number Face Amount Current Yield 2022 Close 11.052024 $ 6,950 11.1% $99.49 12.552026 $ 13,900 12.0% $103.70 14.052028 $ 20,850 12.6% $ 111.32 9.9% 50 s 0 $3.434 $ 12.873 NA 00 Atom 45 16.1 14000 0.00 NA 0.0 0.0 0 0.00 00 Team: Andrews Round: 1 Product Decisions ProductName Performance Size MTBFrdSpec Price PromoBudget Sales Budget UnitSalesForecast Production Ordered CapacityChange AutomationNextRound Finance Decisions Finance Function Finance Decisions Able 60 14.0 17500 27.00 1200 1200 1949 1200 -600 5.0 Acre 3.5 16.5 14000 20.00 1200 1100 1935 1820 0 6.5 Adam 8.5 11.5 23000 37.00 1000 1000 657 410 -300 3.0 Aft 99 15.0 27000 32.00 1000 900 683 440 0 3.0 Agape 45 10.5 20000 32.00 1000 900 688 380 0 3.0 0 0.00 0 0 0 0 0 0 0 0 0 0 600 5.0 0 0 0 0.0 0 0.0 Bondissue AP Stissue 13700 StRetire 0 Dividend 0.00 ShortDebt 0 BondRetir 0 AR 45 0 30 Erie Select a round to view 1 Select Industry C135434_004 selected statistics for round 1 Andrews ROS 2.34% Asset Turnover 1.06 ROA 2.4996 Leverage 1.75 ROE 4.34% Emergency Loans $0 Sales $ 119,401,328 Variable Costs $ 86,821,897 SGA $ 14,541,990 EBIT $ 9,815,774 Profit $ 2,799,471 Cumulative Profit $ 6,987,978 Stock Price $36.54 Market Capitalization $ 87,691,876 S&P Rating BB Working Capital $ 21,101,312 Days of Working Capital 64.5 Free Cash Flow $-5,396,920 Plant and Equipment $ 124,000,000 Total Assets $ 112,652,640 Plant Utilization 95.74% Traditional Segment Share 20.92% Low End Segment Share 13.79% High End Segment Share 17.55% Performance Segment Share 19.81% Size Segment Share 20.15% Overall Market Share 17.58% Complement 701 Overtime 0.00% Turnover Rate 10.00% Productivity Index 100.00% Baldwin 5.52% 1.05 5.77% 2.31 13.36% $0 $ 124,697,122 $ 83,466,845 $ 15,330,624 $ 18,127,525 $6,885,935 $ 11,074,442 $ 43.93 $ 87,862,594 CC $ 20,200,874 59.1 $ 9,279,281 $ 113,300,000 $ 119,278,592 95.92% 17.28% 17.44% 19.47% 12.26% 17.80% 17.19% 740 0.06% 10.01% 100.00% Chester 3.43% 1.14 3.90% 1.81 7.04% $0 $ 118,420,988 $ 84,022,384 $ 14,665,941 $ 11,490.486 $ 4,065,457 $ 8,253,965 $38.46 $ 83,319, 111 BB $ 18,141,000 55.9 $ 6,346,767 $ 113,600,000 $ 104,210,317 99.12% 15,38% 19.54% 16.99% 19 22% 15.61% 17.55% 754 0.00% 10.00% 100.00% Digby 4.19% 1.02 4.27% 253 10.79% $0 $ 116,534,343 $ 77,495,956 $ 16,225,776 $ 15,226,849 $ 4,887968 $ 9,076,475 $38.62 $ 77,245,336 $ 18,931,700 59.3 $ 11,475,307 $ 109,000,000 $ 114,581,418 89.21% 13.49% 15.26% 18.65% 18.38% 18.54% 15.67% 672 0.00% 10.00% 100.00% 4.23% 0.98 4.16% 1 99 8 259 $0 $ 111,370,178 $ 78,480,526 $ 10,915,286 $ 13,590,889 $ 4,707,944 $ 8,896,452 $ 39.63 $ 84,330,674 B $ 18,783,607 616 $ 3,679,883 $ 119,800,000 $ 113,243,189 88.00% 16 91% 20.01% 11.85% 12 55% 12.52% 16.75% 701 0.00% 10.00% 100.00% Ferris 5.58% 1.25 6.97% 1.95 13.59% $0 $ 113,336,706 $ 75,625,135 $ 16,143,097 $ 14,713,257 $6,326,878 $ 10,515,385 $ 42.13 $ 84,253,964 B $ 19,038,999 613 $ 27,065,614 $ 87,800,000 $ 90,780,979 101.65% 16.0496 13.95% 15.48% 17.78% 15.38% 15.25% 663 0.08% 10.01% 100.00% CAPSTONE Coach - File Unde - Decisions Proformas - Reports - Help Om Research & Development Recalculate Name MTBF Revision Date 16-Jun-24 Age at Revision 1.4 Pfmn 6.5 3.5 9.0 10.4 5.0 Size 13.5 16.5 11.0 14.5 10.0 Able Acre Adam Aft Agape Atom NA Teamare Andrews Industry ID: C135434_004 Round: 2 Year 2024 Drafted Mar 20, 2022 06:58PM EST Perceptual Map (at end of this year) 20 18 16 Aged A 14 17500 14000 24000 27000 20000 14000 0 1.0 1.2 12 R&D Costo $464 $0 $406 $366 $366 $179 26-May-24 11-May-24 11-May-24 05-Mar-24 ART Size 1.2 4.5 0.0 16.1 0.0 0.0 SO 2 0 NA 0.0 0.0 0 $0 Total $1781 0 2 4 6 8 10 12 14 16 18 20 Performance Material Cost Age Profile Able w ACH 55:38 Adam Alt Agape Perceived Age In Years 7.95 $10 Material Cost in dollars ID 50 SIS New Material Cost Old Material Cost Able Acre Adam At Agape Atom CAPSTONE Coach Fle Undo- Decisions Profomas Reports Marketing Recalculate Name Price Promo Budget 1500 Sales Budget Your Forecast 2441 Able 26.50 1500 Benchmark Prediction 2,479 1,860 822 Acre $ 19.50 $ 1500 $ 1400 1632 Adam $ 36.50 $ 1300 $ 1300 807 Team name: Andrews Industry ID: C135434_004 Round 2 Year 2024 Draft saved Mar 20, 2002 06:5PM EST Gross Variable Contrib Less Revenue Costs Margin Promo/Sales $ 64,687 $ 47,923 $ 16,763 $ 13,763 $ 31,824 $ 21,168 $ 10,656 $ 7.756 $ 29,456 $ 20,783 $ 8,673 $ 6,073 $ 28,476 $ 23.990 $4,486 $ 1,986 $ 27,311 $ 20,735 $ 6,575 $ 4,075 $ 18,480 $ 15,306 $ 3.174 $ 274 $0 $0 $0 SO $0 $0 $0 $0 $ 200,233 $ 149,900 $ 50,327 $33.927 $ 31.50 $ $ 1200 919 904 1300 1300 $ 31.50 $ $ 1200 873 867 Aft Agape Atom NA $ 20.00 $ 1500 5 1400 859 924 $0.0 $0 SO 0 NA $0.0 $0 0 $0 $ 8.000 Total $ 8,400 7,812 7.575 30 A/R Lao (days) 90 A/P Lag (days) : Revenue Forecast Unit Sales Forecast $64.686 2.442 SO 1.632 Revenue forecast on 000 531,824 528.456 Unit Sales forecast on 000) 528,476 527,310 807 904 518,450 867 Able Acre Adam AP AGRO Arom Able ACH AN ARDE Adam Low High Variable Cost Marketing Margin Alter Marketing Trad Pimn Sie Recalculate Production Teanname Andrews Industry ID: C135434_904 Round: 2 year: 2004 Draft ved at 26, 2022 07PM EST Able Acre Adam Alt 5 Agape Atom NA NA Total 2,441 1,632 802 904 867 924 0 7.525 Production Schedule Unit Sales Forecast Inventory On Hand Production Schedule Production After Ads 19 46 0 0 69 2350 803 904 867 7434 1580 1.570 924 915 205 895 0 7,351 95.8% 13.3 33.8% 507 44.5% 0 0 $8.50 $5.50 $10.52 $10.99 $10.77 0 0 Margins 2nd Shift Production Labor Costunt Material Cost/Unit Total Unt Cost Contribution Marino $7.39 $15.23 $13.15 0 87.5% $8.60 $7.96 $16.56 17.2% $10.95 $19.5) 0 $15.65 5.26.54 $12.97 $25.75 0 0 $22.92 24.1% 25.9% 33.5% 29.4% 15.8% 0 0 Total 1,200 1.000 600 600 600 600 0 0 5,000 200 200 200 200 200 200 1.200 5.0 6.5 30 3.0 5.0 0.0 0.0 Physical Plant 1st Shift Capacity Buy/Sell Coty Automation New Autom. Rating Investment (9000) Workforce Complement 3.0 3.5 5.5 7.0 3.5 3.5 5.5 $8.000 55,200 $5.200 $5.200 $6,500 $0 $ 40,000 $9,600 Needed This Year 2nd Shift Last Year 701 $ 50,821 This Year 1,139 ist Shift 742 $0 Max Invest A/Plag Overtime 0.0% 1,139 100% 397 30 Production vs Capacity Price vs Unit COSE LLLL OL Alom Abie Acre AN Ape Adam AN Agape Both Shifts as Capacity Production Material Labor Margin CAPSTONE POUR Recalculate Finance Terms Andres Industry IDC135490_004 Round 2 Year 2004 Draft served at Mar 20, 2012 07:00PREST Liabilities & Owner's Equity Accounts Payable 69 $40,000 Retained farrings 2018 Current Debt: 4 $0 2,80 $36.51 Long Term Debt: 39.35 Common Stock: 2.6% $1.46 $19,599 17539 Finances Plant Improvements Total Investments (5000) Sales of Plant & Equipment Common Stock Shares Outstanding (000) Price Per Share Earnings Per Share Max Stock Ime (5000) Issue Stock (5000) Max Stock Retire (5000) Retire Stock (5000) Dividend per Share Current Debt Interest Rate Due This Year Borrow (5000) Cash Position December 31, 2023 December 31, 2024 0 $ 0.00 Long Term Debt Retire Long Term Debt (5000) 0 Issue Long Term Debt (5000) 33282 Long Term Interest Rate 11.04 Maximum Issue This Year $33,282 A/R Lag (days) 90 A/P Lag (days) 30 Outstanding Bonds Series Number Face Amount Current Yield 2023 Close 11.052024 $6,950 11.0% $ 100.00 12.552026 $ 13,900 12.1% $103.67 14.052028 $ 20,850 12.6% $111.09 9.6% $0 co $ 0 $11.737 $ 10,637 NA 00 00 0 Team: Andrews Round 2 Product Decisions ProductName Performance Size MTBFrdSpec Price PromoBudget Sales Budget UnitSalesForecast Production Ordered Capacity Change AutomationNextRound Finance Decisions FinanceFunction Finance Decisions HR Decisions Complment 1139 100 Able 65 13.5 17500 26 50 1500 1500 2441 2350 200 5.5 Acre 3.5 16.5 14000 19.50 1500 1400 1632 1586 200 7.0 Adam 90 11.0 24000 36.50 1300 1300 807 803 200 3.5 Aft 10.4 14.5 27000 31 50 1300 1200 904 904 200 3.5 Agape 50 10.0 20000 31.50 1300 1200 867 867 200 3.5 Atom 45 16.1 14000 20.00 1500 1400 924 924 200 5.5 000 0 0 0 0 0 0.0 NA 00 0.0 0 000 0 0 0 0 0 0.0 Stissue 17539 StRetire 0 Dividend 0.00 ShortDebt 0 BondRetir 0 Bondissue 33282 AR 90 AP 30 RecrSpend 0.000 0 TrainHrs 0.000 0 Select a round to view 2 Select Industry C135434_004 selected statistics for round 2 Andrews ROS -0.91% Asset Turnover 0.97 ROA -0.88% Leverage 2.18 ROE - 1939 Emergency Loans $ 7,948,520 Sales $ 170,542,964 Variable Costs $ 129,318,256 SGA $ 19,928,142 EBIT $7,822,213 Profit $- 1,550,732 Cumulative Profit $5,437,246 Stock Price $ 25.78 Market Capitalization $ 74,245,941 S&P Rating Working Capital $ 34,354 288 Days of Working Capital 73.5 Free Cash Flow $- 70,505,621 Plant and Equipment $164,000,000 Total Assets $ 175,276,190 Plant Utilization 147 32% Traditional Segment Share 27.07% Low End Segment Share 18.19% High End Segment Share 20.19% Performance Segment Share 29.84% Size Segment Share 22.78% Overall Market Share 22.67% Complement 1139 Overtime 0.00% Turnover Rate 10.00% Productivity Index 100.00% Baldwin 2.33% 0.90 2.10% 2.46 5.16% SO $ 108, 120,083 $ 71,490,415 $ 17,056,025 $ 11,966,766 $ 2,522,619 $ 13,597,060 $ 38.02 $ 76,049,025 CC $ 16,247,537 54.8 $. 38.750 $ 113,800,000 $ 120,177,293 100.25% 9.71% 17.20% 25.38% 3.43% 7.12% 13.63% 662 0.00% 8.88% 100.00% Chester 5.70% 1.19 6.77% 1.77 12.02% $0 $ 133,935,604 $ 92,550,511 $ 16,388,067 $ 17,173,314 $ 7,631,229 $ 15,885,193 $44.49 $ 96,085,304 BB $ 23,886,981 65.1 $3,691,445 $ 115,600,000 $ 112,681,290 128.59% 12.97% 19.00% 17.72% 21.53% 22.45% 17.59% 813 0.00% 9.06% 100.00% Digby 3.56% 1.01 3.60% 2.56 9.21% $0 $ 137, 112,556 $ 92,886,816 $ 19,263702 $ 16,992,136 $ 4,885,967 $ 13,962.442 $39.98 $ 82,891,817 $ 18,305,723 48.7 $ 15,934,309 $ 125,300,000 $ 135,891,335 122.14% 13.75% 15.15% 18,56% 21.72% 22.13% 16.42% 835 0.00% 8.88% 100.00% Erie 4.06% 0.87 3.53% 207 7.31% $0 $ 104,973,391 $71,751,954 $ 11,681,929 $ 13,595,779 $ 4,259,695 $ 13,156,146 $39.23 $ 83,491,838 B $ 17,322,767 602 $ 638,752 $ 125,318,000 $ 120,558,329 107 20% 25.41% 18.00 0.53% 2.34% 2.87% 15 23% Ferris 5.20% 1.23 6.38% 2.02 12.92% SO $ 123,600,549 $ 84,657,654 $ 18,371,236 $ 15,420,830 $ 6,423,304 $ 16,938,689 $ 45.62 $ 91,243,287 B $ 18,920,326 55.9 $-2,133,521 $ 88,900,000 $ 100,680,311 140.89% 11.09% 12.47% 17.62% 21.149 22.66% 14.46% 760 0.00% 8.889 100.00% 661 0.00% 9.06% 100.00% Recalculate ein Research & Development Pimn Name Able Size 14.0 16.5 6.0 Acre MTBF 17500 14000 23000 27000 20000 3.5 8.5 Teantrame Andrews Industry ID: C13543_004 Round 1 Year: 2023 Draft SevedaMar 20, 2022 05.02PM EST Perceptual Map (at end of this year) 20 18 ALES 16 14 12 Revision Date 28-May-23 19-Jun-23 16-May-23 14-Jun-23 30-May-23 05-Mar-24 R&D Cost $413 $474 $376 $456 11.5 Age at Revision 1.8 25 1.0 1.5 1.5 0.0 Adam Aft Agape Atom NA NA 9.9 15.0 10.5 6 4.5 4.5 0.0 14000 16.1 0.0 0 0 $416 $1179 50 $0 53314 0.0 0.0 S 2 0 0 2 4 6 8 10 12 14 16 18 20 Performance Total Material Cost Age Profile Acre HA ALL Agape Acom Neceived Age in Years Lite 2 TO 501 510 Material Cost in dollars 512.5 517.5 New Material Cost Old Material Cost Able . Acre Adam Aft - Agape Atom Recalculate Marketing Name Price Promo Budget 1200 Sales Budget Your Forecast 1949 27,00 Benchmark Prediction 1,965 2,193 1200 $ $ 1200 $ 1100 1935 Able Acre Adam Aft 20.00 37.00 $ $ 1000 $ 1000 666 Teammes Andres Industry IDC135434_004 Rount: 1 Year: 2003 Dat saved Mar 20, 2022 05:00PM EST Gross Variable Contrib Less Revenue Costs Margin PromoSales $ 52,623 $ 37.520 $ 15,094 $ 12,694 $38.700 $ 29,378 $ 9,322 $7.022 $ 24,309 $ 16,194 $ 8.115 $ 6,115 $ 21,856 $ 16,970 $ 4,886 $2.986 $ 22,016 $15.475 $ 6,541 $4,641 $0 $0 $0 $0 SO SO $0 $0 $0 $0 $0 $0 $ 159,504 $ 115,546 $ 43,958 $33,458 $ $ 1000 s 900 32.00 32.00 657 683 688 710 702 s $ S 900 Agape Atom $0.0 $0 0 NA 1000 $0 $0 $0 $5,400 SO $0.0 $0.0 0 NA 0 $0 $ 5,100 Total 6,236 5,912 AP Lady 30 A/R Lag (day) Revenue Forecast Unit Sales Forecast 552.623 1,950 1,935 538,700 Revenue forecast on 000) Unit Sales forecast on 000's 524,309 321,656 522,016 657 683 688 50 Atom Abe ACH AR Agape A Agape Variable Cost Marketing AN Pfm Margin After Marketing Trad Size CAPSTONE Coach - File- Unde - Decision- Proformas - Reports Help Recalculate Production Team name: Andres Industry ID: C135434_304 Round: 1 Year: 2023 Daftsaved at 20, 2002 05:00PM EST Able Acre Adam AR Agape Atom NA NA Total 1,949 1.935 O 0 5,912 Production Schedule Une Sales Forecast Inventory On Hand Production Schedule Production After Ads 30 40 62 O 0 408 189 1200 78 440 410 380 i 0 4.250 1820 1,802 1,186 436 376 0 4,209 0.0% 30.0% 0.0% 0.0% 0.0% 0.0% 0 0 $7.85 $7.46 SELS $8.97 $8.97 $0.00 0 0 $11.41 57.72 $15.60 $15.88 $9.03 0 0 51352 $22.45 $19.26 $15.18 0 0 $24.65 21.4% 2017 24.14 229.24 0.0 0 Total Margins 2nd Shift Production Labor Cost/Unit Material Costunut Total Unit Cost Contribution Margin Physical Plant 1st Shirt Capacity BuySell Capachy Automation Rating New Autom. Rating Investment (5000) Workforce Complement 1,200 1,400 600 600 600 0 0 0 -600 0 300 0 0 600 (300) 40 5.0 20 3.0 0.0 0.0 0.0 5.0 6.5 3.0 3.0 5.0 $ 3.780) $8.400 3.0 53.510) This year 50 $0 $ 15,600 $0 50 $56.710 Last Your Needed Ist hit 2nd St Max Invest $32,694 This year 201 Overtime 0.0% 200 701 2005 610 61 A/P Lago 30 Production vs Capacity sk Price vs Unit Cost 540 520 1k to be HO OK 50 Able ACHE Adam AT ATO Acre AN Alom Production Both Shis Base Capacity Material Labor Margin Recalculate Finance Teamname: Andres Industry ID. CIASCL_004 Round: 1 year 2023 Drat saved Mar 20, 2122 05:06PM EST Liabilities & Owner's Equity Accounts Payable : 5.85 $ 28,800 Retained Earnings 2685 Current Debtos $12,090) - Long Term Debt: 37 2.000 Finances Plant Improvements Total Investments (5000) Sales of Plant Equipment Common Stock Shares Outstanding (000) Price Per Share Earnings Per Share Max Stock Issue (5000) Issue Stock (5000) Max Stock Retire (5000) Retire Stock (5000) Dividend Per Share Current Debit Interest Rate Due This Year Borrow (5000) Cash Position December 31, 2022 December 31, 2013 $24.25 $123 $ 12,700 13700 $2.405 0 O $ $ 0.00 Commen Stock: 28 Long Term Debt Retire Long Term Debt ($000) O Issue Long Term Debt (5000) Long Term Interest Rate 11.3% Maximum Issue This Year $ 18,994 A/R Lag (days) 45 A/P Lag (days) 30 Outstanding Bonds Series Number Face Amount Current Yield 2022 Close 11.052024 $ 6,950 11.1% $99.49 12.552026 $ 13,900 12.0% $103.70 14.052028 $ 20,850 12.6% $ 111.32 9.9% 50 s 0 $3.434 $ 12.873 NA 00 Atom 45 16.1 14000 0.00 NA 0.0 0.0 0 0.00 00 Team: Andrews Round: 1 Product Decisions ProductName Performance Size MTBFrdSpec Price PromoBudget Sales Budget UnitSalesForecast Production Ordered CapacityChange AutomationNextRound Finance Decisions Finance Function Finance Decisions Able 60 14.0 17500 27.00 1200 1200 1949 1200 -600 5.0 Acre 3.5 16.5 14000 20.00 1200 1100 1935 1820 0 6.5 Adam 8.5 11.5 23000 37.00 1000 1000 657 410 -300 3.0 Aft 99 15.0 27000 32.00 1000 900 683 440 0 3.0 Agape 45 10.5 20000 32.00 1000 900 688 380 0 3.0 0 0.00 0 0 0 0 0 0 0 0 0 0 600 5.0 0 0 0 0.0 0 0.0 Bondissue AP Stissue 13700 StRetire 0 Dividend 0.00 ShortDebt 0 BondRetir 0 AR 45 0 30 Erie Select a round to view 1 Select Industry C135434_004 selected statistics for round 1 Andrews ROS 2.34% Asset Turnover 1.06 ROA 2.4996 Leverage 1.75 ROE 4.34% Emergency Loans $0 Sales $ 119,401,328 Variable Costs $ 86,821,897 SGA $ 14,541,990 EBIT $ 9,815,774 Profit $ 2,799,471 Cumulative Profit $ 6,987,978 Stock Price $36.54 Market Capitalization $ 87,691,876 S&P Rating BB Working Capital $ 21,101,312 Days of Working Capital 64.5 Free Cash Flow $-5,396,920 Plant and Equipment $ 124,000,000 Total Assets $ 112,652,640 Plant Utilization 95.74% Traditional Segment Share 20.92% Low End Segment Share 13.79% High End Segment Share 17.55% Performance Segment Share 19.81% Size Segment Share 20.15% Overall Market Share 17.58% Complement 701 Overtime 0.00% Turnover Rate 10.00% Productivity Index 100.00% Baldwin 5.52% 1.05 5.77% 2.31 13.36% $0 $ 124,697,122 $ 83,466,845 $ 15,330,624 $ 18,127,525 $6,885,935 $ 11,074,442 $ 43.93 $ 87,862,594 CC $ 20,200,874 59.1 $ 9,279,281 $ 113,300,000 $ 119,278,592 95.92% 17.28% 17.44% 19.47% 12.26% 17.80% 17.19% 740 0.06% 10.01% 100.00% Chester 3.43% 1.14 3.90% 1.81 7.04% $0 $ 118,420,988 $ 84,022,384 $ 14,665,941 $ 11,490.486 $ 4,065,457 $ 8,253,965 $38.46 $ 83,319, 111 BB $ 18,141,000 55.9 $ 6,346,767 $ 113,600,000 $ 104,210,317 99.12% 15,38% 19.54% 16.99% 19 22% 15.61% 17.55% 754 0.00% 10.00% 100.00% Digby 4.19% 1.02 4.27% 253 10.79% $0 $ 116,534,343 $ 77,495,956 $ 16,225,776 $ 15,226,849 $ 4,887968 $ 9,076,475 $38.62 $ 77,245,336 $ 18,931,700 59.3 $ 11,475,307 $ 109,000,000 $ 114,581,418 89.21% 13.49% 15.26% 18.65% 18.38% 18.54% 15.67% 672 0.00% 10.00% 100.00% 4.23% 0.98 4.16% 1 99 8 259 $0 $ 111,370,178 $ 78,480,526 $ 10,915,286 $ 13,590,889 $ 4,707,944 $ 8,896,452 $ 39.63 $ 84,330,674 B $ 18,783,607 616 $ 3,679,883 $ 119,800,000 $ 113,243,189 88.00% 16 91% 20.01% 11.85% 12 55% 12.52% 16.75% 701 0.00% 10.00% 100.00% Ferris 5.58% 1.25 6.97% 1.95 13.59% $0 $ 113,336,706 $ 75,625,135 $ 16,143,097 $ 14,713,257 $6,326,878 $ 10,515,385 $ 42.13 $ 84,253,964 B $ 19,038,999 613 $ 27,065,614 $ 87,800,000 $ 90,780,979 101.65% 16.0496 13.95% 15.48% 17.78% 15.38% 15.25% 663 0.08% 10.01% 100.00% CAPSTONE Coach - File Unde - Decisions Proformas - Reports - Help Om Research & Development Recalculate Name MTBF Revision Date 16-Jun-24 Age at Revision 1.4 Pfmn 6.5 3.5 9.0 10.4 5.0 Size 13.5 16.5 11.0 14.5 10.0 Able Acre Adam Aft Agape Atom NA Teamare Andrews Industry ID: C135434_004 Round: 2 Year 2024 Drafted Mar 20, 2022 06:58PM EST Perceptual Map (at end of this year) 20 18 16 Aged A 14 17500 14000 24000 27000 20000 14000 0 1.0 1.2 12 R&D Costo $464 $0 $406 $366 $366 $179 26-May-24 11-May-24 11-May-24 05-Mar-24 ART Size 1.2 4.5 0.0 16.1 0.0 0.0 SO 2 0 NA 0.0 0.0 0 $0 Total $1781 0 2 4 6 8 10 12 14 16 18 20 Performance Material Cost Age Profile Able w ACH 55:38 Adam Alt Agape Perceived Age In Years 7.95 $10 Material Cost in dollars ID 50 SIS New Material Cost Old Material Cost Able Acre Adam At Agape Atom CAPSTONE Coach Fle Undo- Decisions Profomas Reports Marketing Recalculate Name Price Promo Budget 1500 Sales Budget Your Forecast 2441 Able 26.50 1500 Benchmark Prediction 2,479 1,860 822 Acre $ 19.50 $ 1500 $ 1400 1632 Adam $ 36.50 $ 1300 $ 1300 807 Team name: Andrews Industry ID: C135434_004 Round 2 Year 2024 Draft saved Mar 20, 2002 06:5PM EST Gross Variable Contrib Less Revenue Costs Margin Promo/Sales $ 64,687 $ 47,923 $ 16,763 $ 13,763 $ 31,824 $ 21,168 $ 10,656 $ 7.756 $ 29,456 $ 20,783 $ 8,673 $ 6,073 $ 28,476 $ 23.990 $4,486 $ 1,986 $ 27,311 $ 20,735 $ 6,575 $ 4,075 $ 18,480 $ 15,306 $ 3.174 $ 274 $0 $0 $0 SO $0 $0 $0 $0 $ 200,233 $ 149,900 $ 50,327 $33.927 $ 31.50 $ $ 1200 919 904 1300 1300 $ 31.50 $ $ 1200 873 867 Aft Agape Atom NA $ 20.00 $ 1500 5 1400 859 924 $0.0 $0 SO 0 NA $0.0 $0 0 $0 $ 8.000 Total $ 8,400 7,812 7.575 30 A/R Lao (days) 90 A/P Lag (days) : Revenue Forecast Unit Sales Forecast $64.686 2.442 SO 1.632 Revenue forecast on 000 531,824 528.456 Unit Sales forecast on 000) 528,476 527,310 807 904 518,450 867 Able Acre Adam AP AGRO Arom Able ACH AN ARDE Adam Low High Variable Cost Marketing Margin Alter Marketing Trad Pimn Sie Recalculate Production Teanname Andrews Industry ID: C135434_904 Round: 2 year: 2004 Draft ved at 26, 2022 07PM EST Able Acre Adam Alt 5 Agape Atom NA NA Total 2,441 1,632 802 904 867 924 0 7.525 Production Schedule Unit Sales Forecast Inventory On Hand Production Schedule Production After Ads 19 46 0 0 69 2350 803 904 867 7434 1580 1.570 924 915 205 895 0 7,351 95.8% 13.3 33.8% 507 44.5% 0 0 $8.50 $5.50 $10.52 $10.99 $10.77 0 0 Margins 2nd Shift Production Labor Costunt Material Cost/Unit Total Unt Cost Contribution Marino $7.39 $15.23 $13.15 0 87.5% $8.60 $7.96 $16.56 17.2% $10.95 $19.5) 0 $15.65 5.26.54 $12.97 $25.75 0 0 $22.92 24.1% 25.9% 33.5% 29.4% 15.8% 0 0 Total 1,200 1.000 600 600 600 600 0 0 5,000 200 200 200 200 200 200 1.200 5.0 6.5 30 3.0 5.0 0.0 0.0 Physical Plant 1st Shift Capacity Buy/Sell Coty Automation New Autom. Rating Investment (9000) Workforce Complement 3.0 3.5 5.5 7.0 3.5 3.5 5.5 $8.000 55,200 $5.200 $5.200 $6,500 $0 $ 40,000 $9,600 Needed This Year 2nd Shift Last Year 701 $ 50,821 This Year 1,139 ist Shift 742 $0 Max Invest A/Plag Overtime 0.0% 1,139 100% 397 30 Production vs Capacity Price vs Unit COSE LLLL OL Alom Abie Acre AN Ape Adam AN Agape Both Shifts as Capacity Production Material Labor Margin CAPSTONE POUR Recalculate Finance Terms Andres Industry IDC135490_004 Round 2 Year 2004 Draft served at Mar 20, 2012 07:00PREST Liabilities & Owner's Equity Accounts Payable 69 $40,000 Retained farrings 2018 Current Debt: 4 $0 2,80 $36.51 Long Term Debt: 39.35 Common Stock: 2.6% $1.46 $19,599 17539 Finances Plant Improvements Total Investments (5000) Sales of Plant & Equipment Common Stock Shares Outstanding (000) Price Per Share Earnings Per Share Max Stock Ime (5000) Issue Stock (5000) Max Stock Retire (5000) Retire Stock (5000) Dividend per Share Current Debt Interest Rate Due This Year Borrow (5000) Cash Position December 31, 2023 December 31, 2024 0 $ 0.00 Long Term Debt Retire Long Term Debt (5000) 0 Issue Long Term Debt (5000) 33282 Long Term Interest Rate 11.04 Maximum Issue This Year $33,282 A/R Lag (days) 90 A/P Lag (days) 30 Outstanding Bonds Series Number Face Amount Current Yield 2023 Close 11.052024 $6,950 11.0% $ 100.00 12.552026 $ 13,900 12.1% $103.67 14.052028 $ 20,850 12.6% $111.09 9.6% $0 co $ 0 $11.737 $ 10,637 NA 00 00 0 Team: Andrews Round 2 Product Decisions ProductName Performance Size MTBFrdSpec Price PromoBudget Sales Budget UnitSalesForecast Production Ordered Capacity Change AutomationNextRound Finance Decisions FinanceFunction Finance Decisions HR Decisions Complment 1139 100 Able 65 13.5 17500 26 50 1500 1500 2441 2350 200 5.5 Acre 3.5 16.5 14000 19.50 1500 1400 1632 1586 200 7.0 Adam 90 11.0 24000 36.50 1300 1300 807 803 200 3.5 Aft 10.4 14.5 27000 31 50 1300 1200 904 904 200 3.5 Agape 50 10.0 20000 31.50 1300 1200 867 867 200 3.5 Atom 45 16.1 14000 20.00 1500 1400 924 924 200 5.5 000 0 0 0 0 0 0.0 NA 00 0.0 0 000 0 0 0 0 0 0.0 Stissue 17539 StRetire 0 Dividend 0.00 ShortDebt 0 BondRetir 0 Bondissue 33282 AR 90 AP 30 RecrSpend 0.000 0 TrainHrs 0.000 0 Select a round to view 2 Select Industry C135434_004 selected statistics for round 2 Andrews ROS -0.91% Asset Turnover 0.97 ROA -0.88% Leverage 2.18 ROE - 1939 Emergency Loans $ 7,948,520 Sales $ 170,542,964 Variable Costs $ 129,318,256 SGA $ 19,928,142 EBIT $7,822,213 Profit $- 1,550,732 Cumulative Profit $5,437,246 Stock Price $ 25.78 Market Capitalization $ 74,245,941 S&P Rating Working Capital $ 34,354 288 Days of Working Capital 73.5 Free Cash Flow $- 70,505,621 Plant and Equipment $164,000,000 Total Assets $ 175,276,190 Plant Utilization 147 32% Traditional Segment Share 27.07% Low End Segment Share 18.19% High End Segment Share 20.19% Performance Segment Share 29.84% Size Segment Share 22.78% Overall Market Share 22.67% Complement 1139 Overtime 0.00% Turnover Rate 10.00% Productivity Index 100.00% Baldwin 2.33% 0.90 2.10% 2.46 5.16% SO $ 108, 120,083 $ 71,490,415 $ 17,056,025 $ 11,966,766 $ 2,522,619 $ 13,597,060 $ 38.02 $ 76,049,025 CC $ 16,247,537 54.8 $. 38.750 $ 113,800,000 $ 120,177,293 100.25% 9.71% 17.20% 25.38% 3.43% 7.12% 13.63% 662 0.00% 8.88% 100.00% Chester 5.70% 1.19 6.77% 1.77 12.02% $0 $ 133,935,604 $ 92,550,511 $ 16,388,067 $ 17,173,314 $ 7,631,229 $ 15,885,193 $44.49 $ 96,085,304 BB $ 23,886,981 65.1 $3,691,445 $ 115,600,000 $ 112,681,290 128.59% 12.97% 19.00% 17.72% 21.53% 22.45% 17.59% 813 0.00% 9.06% 100.00% Digby 3.56% 1.01 3.60% 2.56 9.21% $0 $ 137, 112,556 $ 92,886,816 $ 19,263702 $ 16,992,136 $ 4,885,967 $ 13,962.442 $39.98 $ 82,891,817 $ 18,305,723 48.7 $ 15,934,309 $ 125,300,000 $ 135,891,335 122.14% 13.75% 15.15% 18,56% 21.72% 22.13% 16.42% 835 0.00% 8.88% 100.00% Erie 4.06% 0.87 3.53% 207 7.31% $0 $ 104,973,391 $71,751,954 $ 11,681,929 $ 13,595,779 $ 4,259,695 $ 13,156,146 $39.23 $ 83,491,838 B $ 17,322,767 602 $ 638,752 $ 125,318,000 $ 120,558,329 107 20% 25.41% 18.00 0.53% 2.34% 2.87% 15 23% Ferris 5.20% 1.23 6.38% 2.02 12.92% SO $ 123,600,549 $ 84,657,654 $ 18,371,236 $ 15,420,830 $ 6,423,304 $ 16,938,689 $ 45.62 $ 91,243,287 B $ 18,920,326 55.9 $-2,133,521 $ 88,900,000 $ 100,680,311 140.89% 11.09% 12.47% 17.62% 21.149 22.66% 14.46% 760 0.00% 8.889 100.00% 661 0.00% 9.06% 100.00%
Step by Step Solution
There are 3 Steps involved in it

Get step-by-step solutions from verified subject matter experts