

Question: LOW Squared Deviation Equal Portfolio Squared Deviation 1 Problem 5b 2 The following table contains annual returns for the stocks of Home Depot and Lowes.
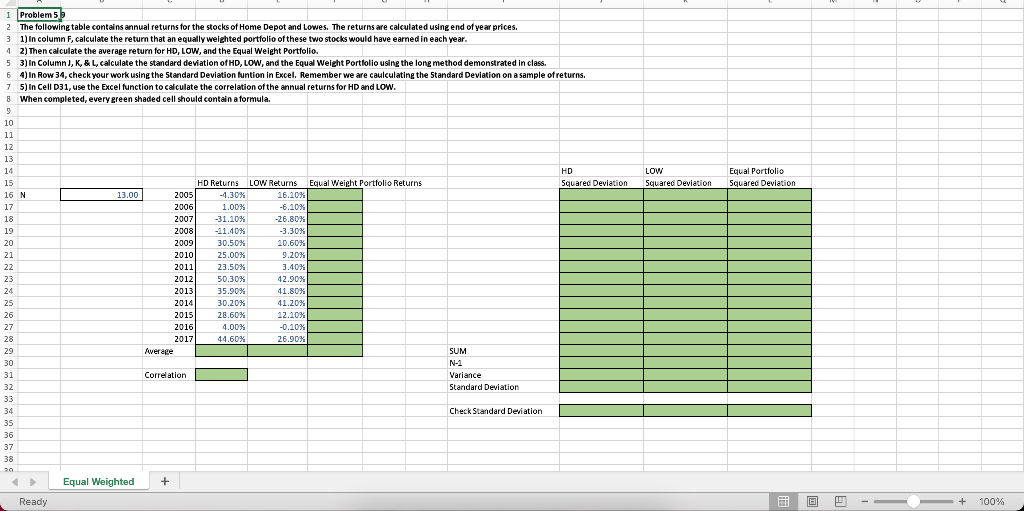
LOW Squared Deviation Equal Portfolio Squared Deviation 1 Problem 5b 2 The following table contains annual returns for the stocks of Home Depot and Lowes. The returns are calculated using end of year prices. 3 1) In column F, calculate the return that an equally weighted portfolio of these two stocks would have earned in each year. 12) Then calculate the average return for HD, LOW, and the Equal Weight Portfolio. 5 3) In Column J, K, & L, calculate the standard deviation of HD, LOW, and the Equal Weight Portfolio using the long method demonstrated in class. 64) In Row 34, check your work using the Standard deviation funtion in Excel. Remember we are caulculating the Standard Deviation on a sample of returns. 7 5) In Cell D31, use the Excel function to calculate the correlation of the annual returns for HD and LOW. 8 When completed, every green shaded cell should contain a formula. 9 10 11 12 13 14 HD 15 HD Returns LOW Returns Equal Weight Portfolio Returns Squared Deviation 16 N 13.00 2005 -4.30% 16.10% 17 2006 1.00% -6.10% 18 2007 -31.10% -26.80% 19 2008 -11.40% -3.30% 20 2009 30.50% 10.60% 21 2010 25.00% 9.20% 22 2011 23.50% 3.40% 23 2012 50.30% 42.90% 24 2013 35.90% 41.80% 25 2014 30.20% 41.20% 26 2015 28.60% 12.10% 27 2016 4.00% -0.109 % 28 2017 44.60% 26.90% 29 Average SUM 30 N-1 31 Correlation Variance 32 Standard Deviation 33 34 Check Standard Deviation 35 36 37 38 20 Equal Weighted + Ready - - + 100% LOW Squared Deviation Equal Portfolio Squared Deviation 1 Problem 5b 2 The following table contains annual returns for the stocks of Home Depot and Lowes. The returns are calculated using end of year prices. 3 1) In column F, calculate the return that an equally weighted portfolio of these two stocks would have earned in each year. 12) Then calculate the average return for HD, LOW, and the Equal Weight Portfolio. 5 3) In Column J, K, & L, calculate the standard deviation of HD, LOW, and the Equal Weight Portfolio using the long method demonstrated in class. 64) In Row 34, check your work using the Standard deviation funtion in Excel. Remember we are caulculating the Standard Deviation on a sample of returns. 7 5) In Cell D31, use the Excel function to calculate the correlation of the annual returns for HD and LOW. 8 When completed, every green shaded cell should contain a formula. 9 10 11 12 13 14 HD 15 HD Returns LOW Returns Equal Weight Portfolio Returns Squared Deviation 16 N 13.00 2005 -4.30% 16.10% 17 2006 1.00% -6.10% 18 2007 -31.10% -26.80% 19 2008 -11.40% -3.30% 20 2009 30.50% 10.60% 21 2010 25.00% 9.20% 22 2011 23.50% 3.40% 23 2012 50.30% 42.90% 24 2013 35.90% 41.80% 25 2014 30.20% 41.20% 26 2015 28.60% 12.10% 27 2016 4.00% -0.109 % 28 2017 44.60% 26.90% 29 Average SUM 30 N-1 31 Correlation Variance 32 Standard Deviation 33 34 Check Standard Deviation 35 36 37 38 20 Equal Weighted + Ready - - + 100%
Step by Step Solution
There are 3 Steps involved in it

Get step-by-step solutions from verified subject matter experts