

Question: PLEASE BE AWARE THAT THIS AN 11 PART QUESTION :) The following table, , contains annual returns for the stocks of Home Depot (HD) and
PLEASE BE AWARE THAT THIS AN 11 PART QUESTION :)
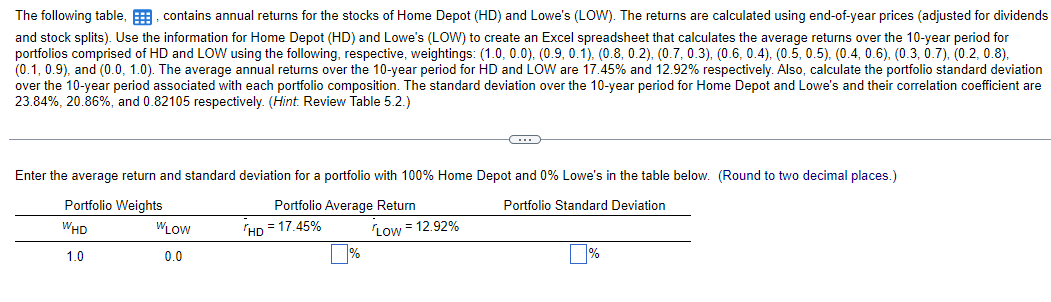
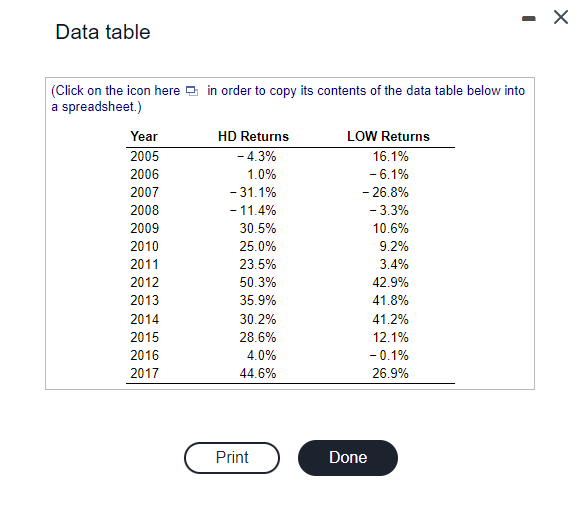
The following table, , contains annual returns for the stocks of Home Depot (HD) and Lowe's (LOW). The returns are calculated using end-of-year prices (adjusted for dividends and stock splits). Use the information for Home Depot (HD) and Lowe's (LOW) to create an Excel spreadsheet that calculates the average returns over the 10-year period for portfolios comprised of HD and LOW using the following, respective, weightings: (1.0,0.0),(0.9,0.1),(0.8,0.2),(0.7,0.3),(0.6,0.4),(0.5,0.5),(0.4,0.6),(0.3,0.7),(0.2,0.8), (0.1,0.9), and (0.0,1.0). The average annual returns over the 10 -year period for HD and LOW are 17.45% and 12.92% respectively. Also, calculate the portfolio standard deviation over the 10 -year period associated with each portfolio composition. The standard deviation over the 10-year period for Home Depot and Lowe's and their correlation coefficient are 23.84%,20.86%, and 0.82105 respectively. (Hint. Review Table 5.2.) Enter the average return and standard deviation for a portfolio with 100% Home Depot and 0% Lowe's in the table below. (Round to two decimal places.) Data table (Click on the icon here in order to copy its contents of the data table below into a spreadsheet.)
Step by Step Solution
There are 3 Steps involved in it

Get step-by-step solutions from verified subject matter experts