

Question: Lxcel One structure The data for Rhodes Corporation's has been collected in the Microsoft Excel Online file below. Open the spreadsheet and perform the required
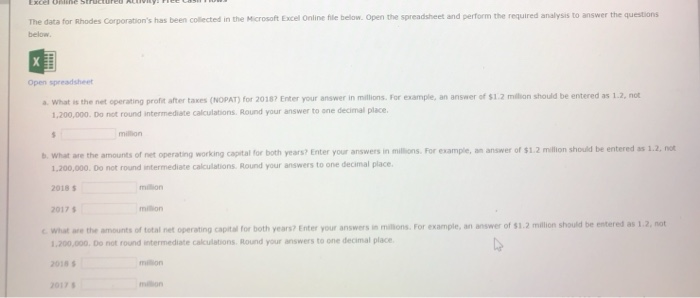
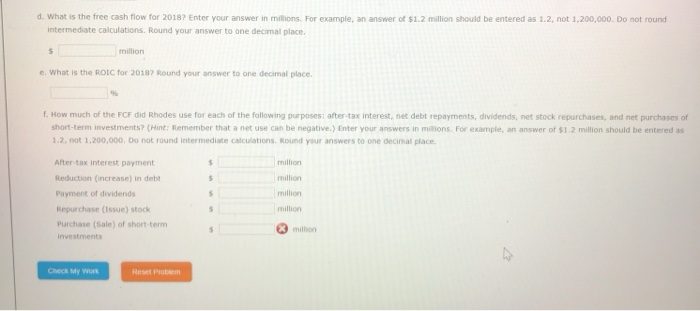
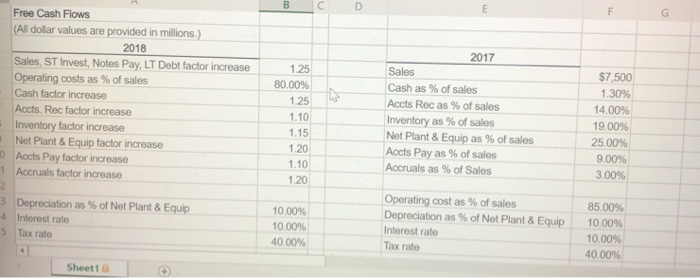
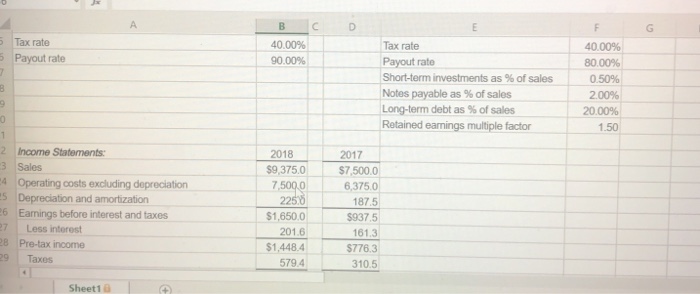
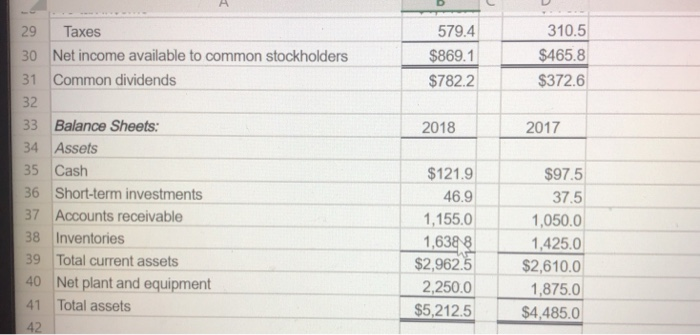
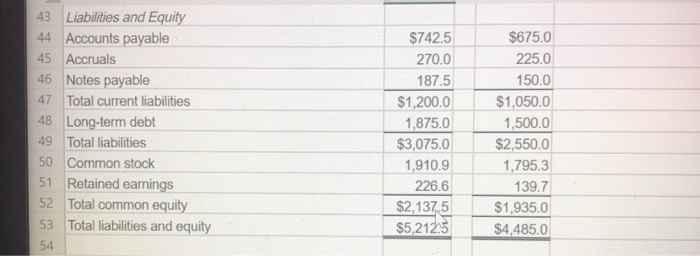
Lxcel One structure The data for Rhodes Corporation's has been collected in the Microsoft Excel Online file below. Open the spreadsheet and perform the required analysis to answer the questions below x Open spreadsheet 3. What is the net operating profit after taxes (NOPAT) for 2018? Enter your answer in millions. For example, an answer of $12 million should be entered as 1.2, not 1,200,000. Do not round intermediate calculations. Round your answer to one decimal place millon b. What are the amounts of net operating working capital for both years? Enter your answers in millions. For example, an answer of $1.2 million should be entered as 1.2, not 1.200,000. Do not round intermediate calculations. Round your answers to one decimal place. 2018 5 20175 What are the amounts of total net operating capital for both years? Enter your answers in milions. For example, an answer of $1.2 million should be entered as 12, not 1.200,000. Do not round intermediate calculations. Round your answers to one decimal place 2018 5 d. What is the free cash flow for 2018? Enter your answer in millions. For example, an answer of $1.2 million should be entered as 1.2, not 1,200,000. Do not round intermediate calculations. Round your answer to one decimal place. $ million e. What is the ROIC for 2018? Round your answer to one decimal place 1. How much of the FCF did Rhodes use for each of the following purposes after tax interest, net debt repayments, dividends, net stock repurchases, and net purchases of short-term investments (Hint: Remember that a net use can be negative.) Enter your answers in milions. For example, an answer of $1.2 million should be entered as 1.2, not 1,200,000. Do not round intermediate calculations. Round your answers to one decimal place. million million $ $ After-tax interest payment Reduction (increase) in debt Payment of dividends Repurchase (Issue) stock Purchase (Sale) of short term investments million x million Check My Won Res Problem B D E G w Free Cash Flows (All doilar values are provided in millions.) 2018 Sales, ST Invest, Notes Pay, LT Debt factor increase Operating costs as % of sales Cash factor increase Accts. Rec factor increase Inventory factor increase Net Plant & Equip factor increase Acts Pay factor increase 1 Accruals factor increase 2 3 Depreciation as % of Net Plant & Equip 4 Interest rate 5 Tax rate 1.25 80.00% 1.25 1.10 1.15 1.20 1.10 1.20 2017 Sales Cash as % of sales Accts Rec as % of sales Inventory as % of sales Net Plant & Equip as % of sales Aucts Pay as % of sales Accruals as % of Sales $7,500 1.30% 14.00% 19.00% 25.00% 9.00% 3.00% 10.00% 10.00% 40.00% Operating cost as % of sales Depreciation as % of Net Plant & Equip Interest rate Tax rate 85.00% 10.0096 10.00% 40.00% Sheet1 A B C D F G 5 Tax rate 5 Payout rate 40.00% 90.00% 7 E Tax rate Payout rate Short-term investments as % of sales Notes payable as % of sales Long-term debt as % of sales Retained earnings multiple factor 40.00% 80.00% 0.50% 2009 20.00% 1.50 B 9 0 1 2 Income Statements: 3 Sales 4 Operating costs excluding depreciation 5 Depreciation and amortization 26 Earnings before interest and taxes 7 Less interest 28 Pre-tax income Taxos 2018 $9,375.0 7,500.0 2258 $1,650.0 201.6 $1,448.4 579.4 2017 $7,500.0 6,3750 187.5 $937.5 161.3 $776.3 310.5 Sheet1 579.4 $869.1 $782.2 310.5 $465.8 $372.6 2018 2017 29 Taxes 30 Net income available to common stockholders 31 Common dividends 32 33 Balance Sheets: 34 Assets 35 Cash 36 Short-term investments 37 Accounts receivable 38 Inventories 39 Total current assets 40 Net plant and equipment 41 Total assets 42 $121.9 46.9 1,155.0 1,638 8 $2,962,5 2,250.0 $5,212.5 $97.5 37.5 1,050.0 1,425.0 $2,610.0 1,875.0 $4,485.0 43 Liabilities and Equity 44 Accounts payable 45 Accruals 46 Notes payable 47 Total current liabilities 48 Long-term debt 49 Total liabilities 50 Common stock 51 Retained earnings 52 Total common equity 53 Total liabilities and equity $742.5 270.0 187.5 $1,200.0 1,875.0 $3,075.0 1,910.9 226.6 $2,1375 $5,212.5 $675.0 225.0 150.0 $1,050.0 1,500.0 $2,550.0 1,795.3 139.7 $1,935.0 $4,485.0 54
Step by Step Solution
There are 3 Steps involved in it

Get step-by-step solutions from verified subject matter experts