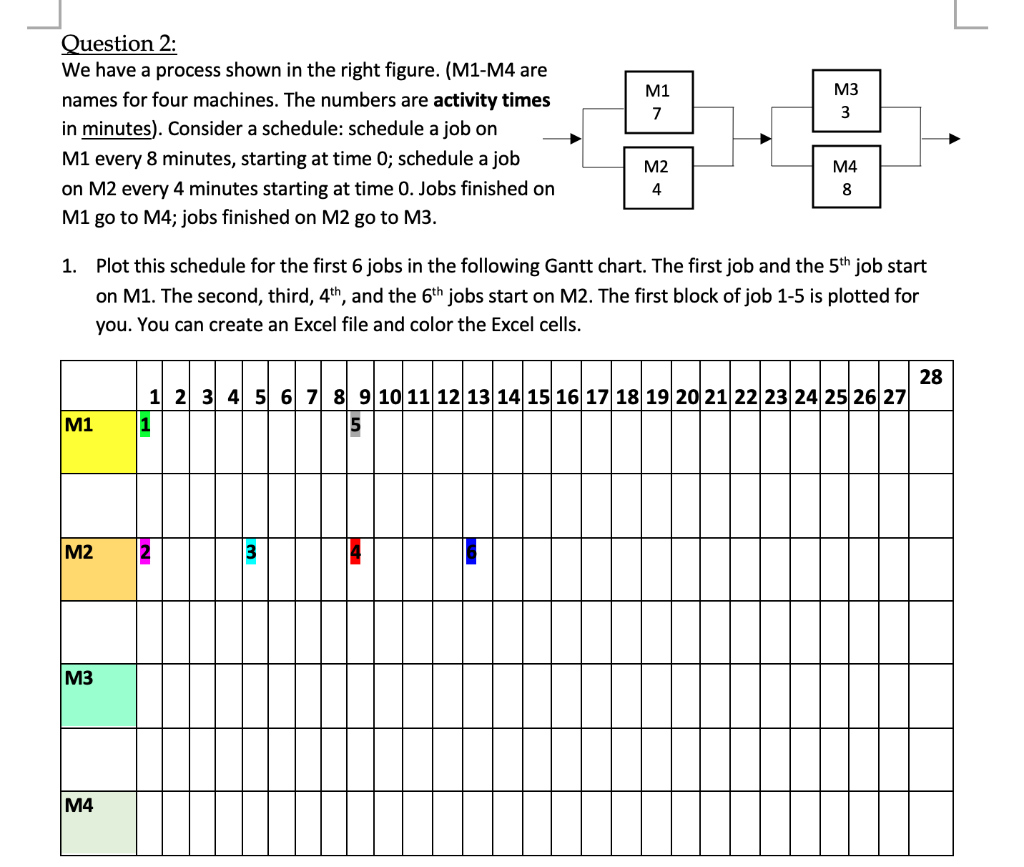
Question: M3 M1 7 3 Question 2: We have a process shown in the right figure. (M1-M4 are names for four machines. The numbers are activity

M3 M1 7 3 Question 2: We have a process shown in

M3 M1 7 3 Question 2: We have a process shown in the right figure. (M1-M4 are names for four machines. The numbers are activity times in minutes). Consider a schedule: schedule a job on M1 every 8 minutes, starting at time 0; schedule a job on M2 every 4 minutes starting at time 0. Jobs finished on M1 go to M4; jobs finished on M2 go to M3. M2 4 M4 8 1. Plot this schedule for the first 6 jobs in the following Gantt chart. The first job and the 5th job start on M1. The second, third, 4th, and the 6th jobs start on M2. The first block of job 1-5 is plotted for you. You can create an Excel file and color the Excel cells. 28 1 2 3 4 5 6 7 8 9 10 11 12 13 14 15 16 17 18 19 20 21 22 23 24 25 26 27 M1 5 M2 M3 M4

Step by Step Solution

There are 3 Steps involved in it

1 Expert Approved Answer
Step: 1 Unlock blur-text-image
Question Has Been Solved by an Expert!

Get step-by-step solutions from verified subject matter experts

Step: 2 Unlock
Step: 3 Unlock

Students Have Also Explored These Related General Management Questions!