

Question: machine 1 98.8 machine 2 Lower specification is 95 100.6 102.3 103.5 100.9 104.7 101.0 103.0 96.6 102.4 99.5 100.6 101.9 102.2 101.3 95.3
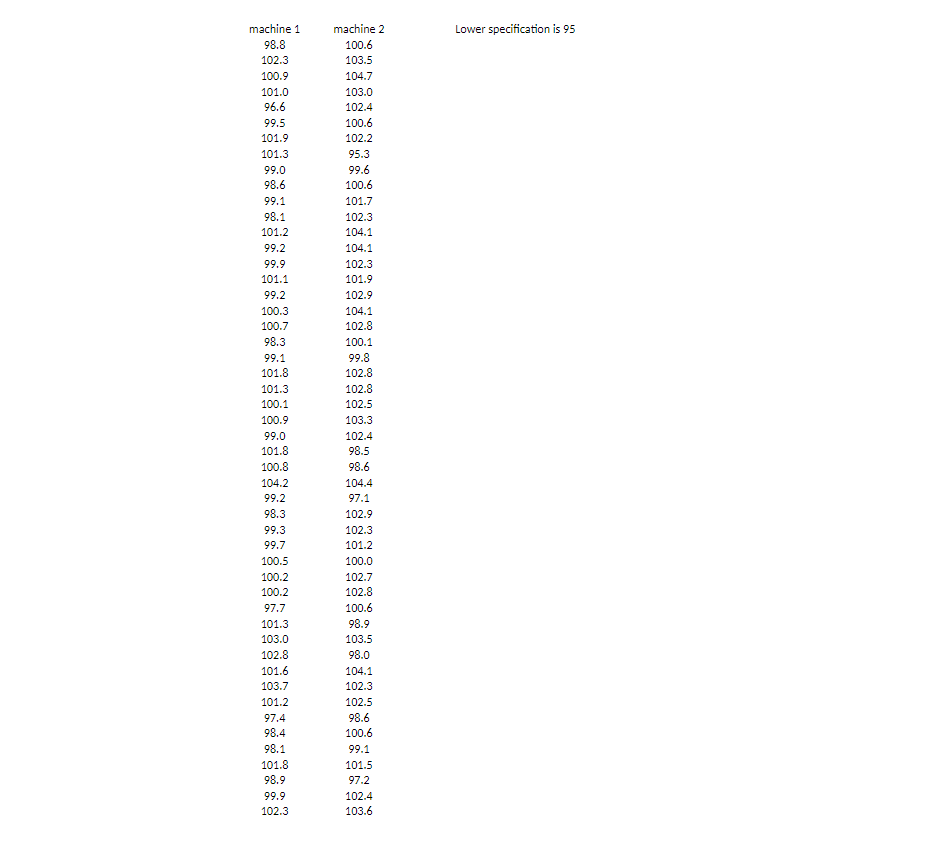
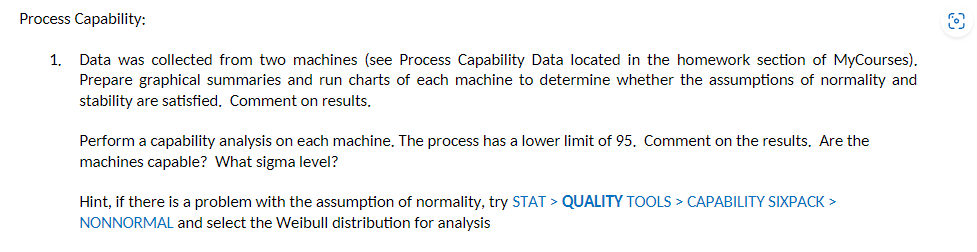
machine 1 98.8 machine 2 Lower specification is 95 100.6 102.3 103.5 100.9 104.7 101.0 103.0 96.6 102.4 99.5 100.6 101.9 102.2 101.3 95.3 99.0 99.6 98.6 100.6 99.1 101.7 98.1 102.3 101.2 104.1 99.2 104.1 99.9 102.3 101.1 101.9 99.2 102.9 100.3 104.1 100.7 102.8 98.3 100.1 99.1 99.8 101.8 102.8 101.3 102.8 100.1 102.5 100.9 103.3 99.0 102.4 101.8 98.5 100.8 98.6 104.2 104.4 99.2 97.1 98.3 102.9 99.3 102.3 99.7 101.2 100.5 100.0 100.2 102.7 100.2 102.8 97.7 100.6 101.3 98.9 103.0 103.5 102.8 98.0 101.6 104.1 103.7 102.3 101.2 102.5 97.4 98.6 98.4 100.6 98.1 99.1 101.8 101.5 98.9 97.2 99.9 102.4 102.3 103.6 8 Process Capability: 1. Data was collected from two machines (see Process Capability Data located in the homework section of MyCourses). Prepare graphical summaries and run charts of each machine to determine whether the assumptions of normality and stability are satisfied. Comment on results. Perform a capability analysis on each machine. The process has a lower limit of 95. Comment on the results. Are the machines capable? What sigma level? Hint, if there is a problem with the assumption of normality, try STAT > QUALITY TOOLS > CAPABILITY SIXPACK > NONNORMAL and select the Weibull distribution for analysis
Step by Step Solution
There are 3 Steps involved in it
To inspect the data and give a step by step explanation well consider Machine 1 and Machine 2 freely take a gander at their display and conclude whether they meet the predefined necessities Stage 1 Re... View full answer

Get step-by-step solutions from verified subject matter experts