

Question: Machine Operator Quantitative Question Strength 109 110 32.43277 110 30.48653 115 17.37635 20.4798 108 109 16.6879 OWNNHHAAWWNN 110 23.60971 108 18.75972 110 17.20057 33.3661 112

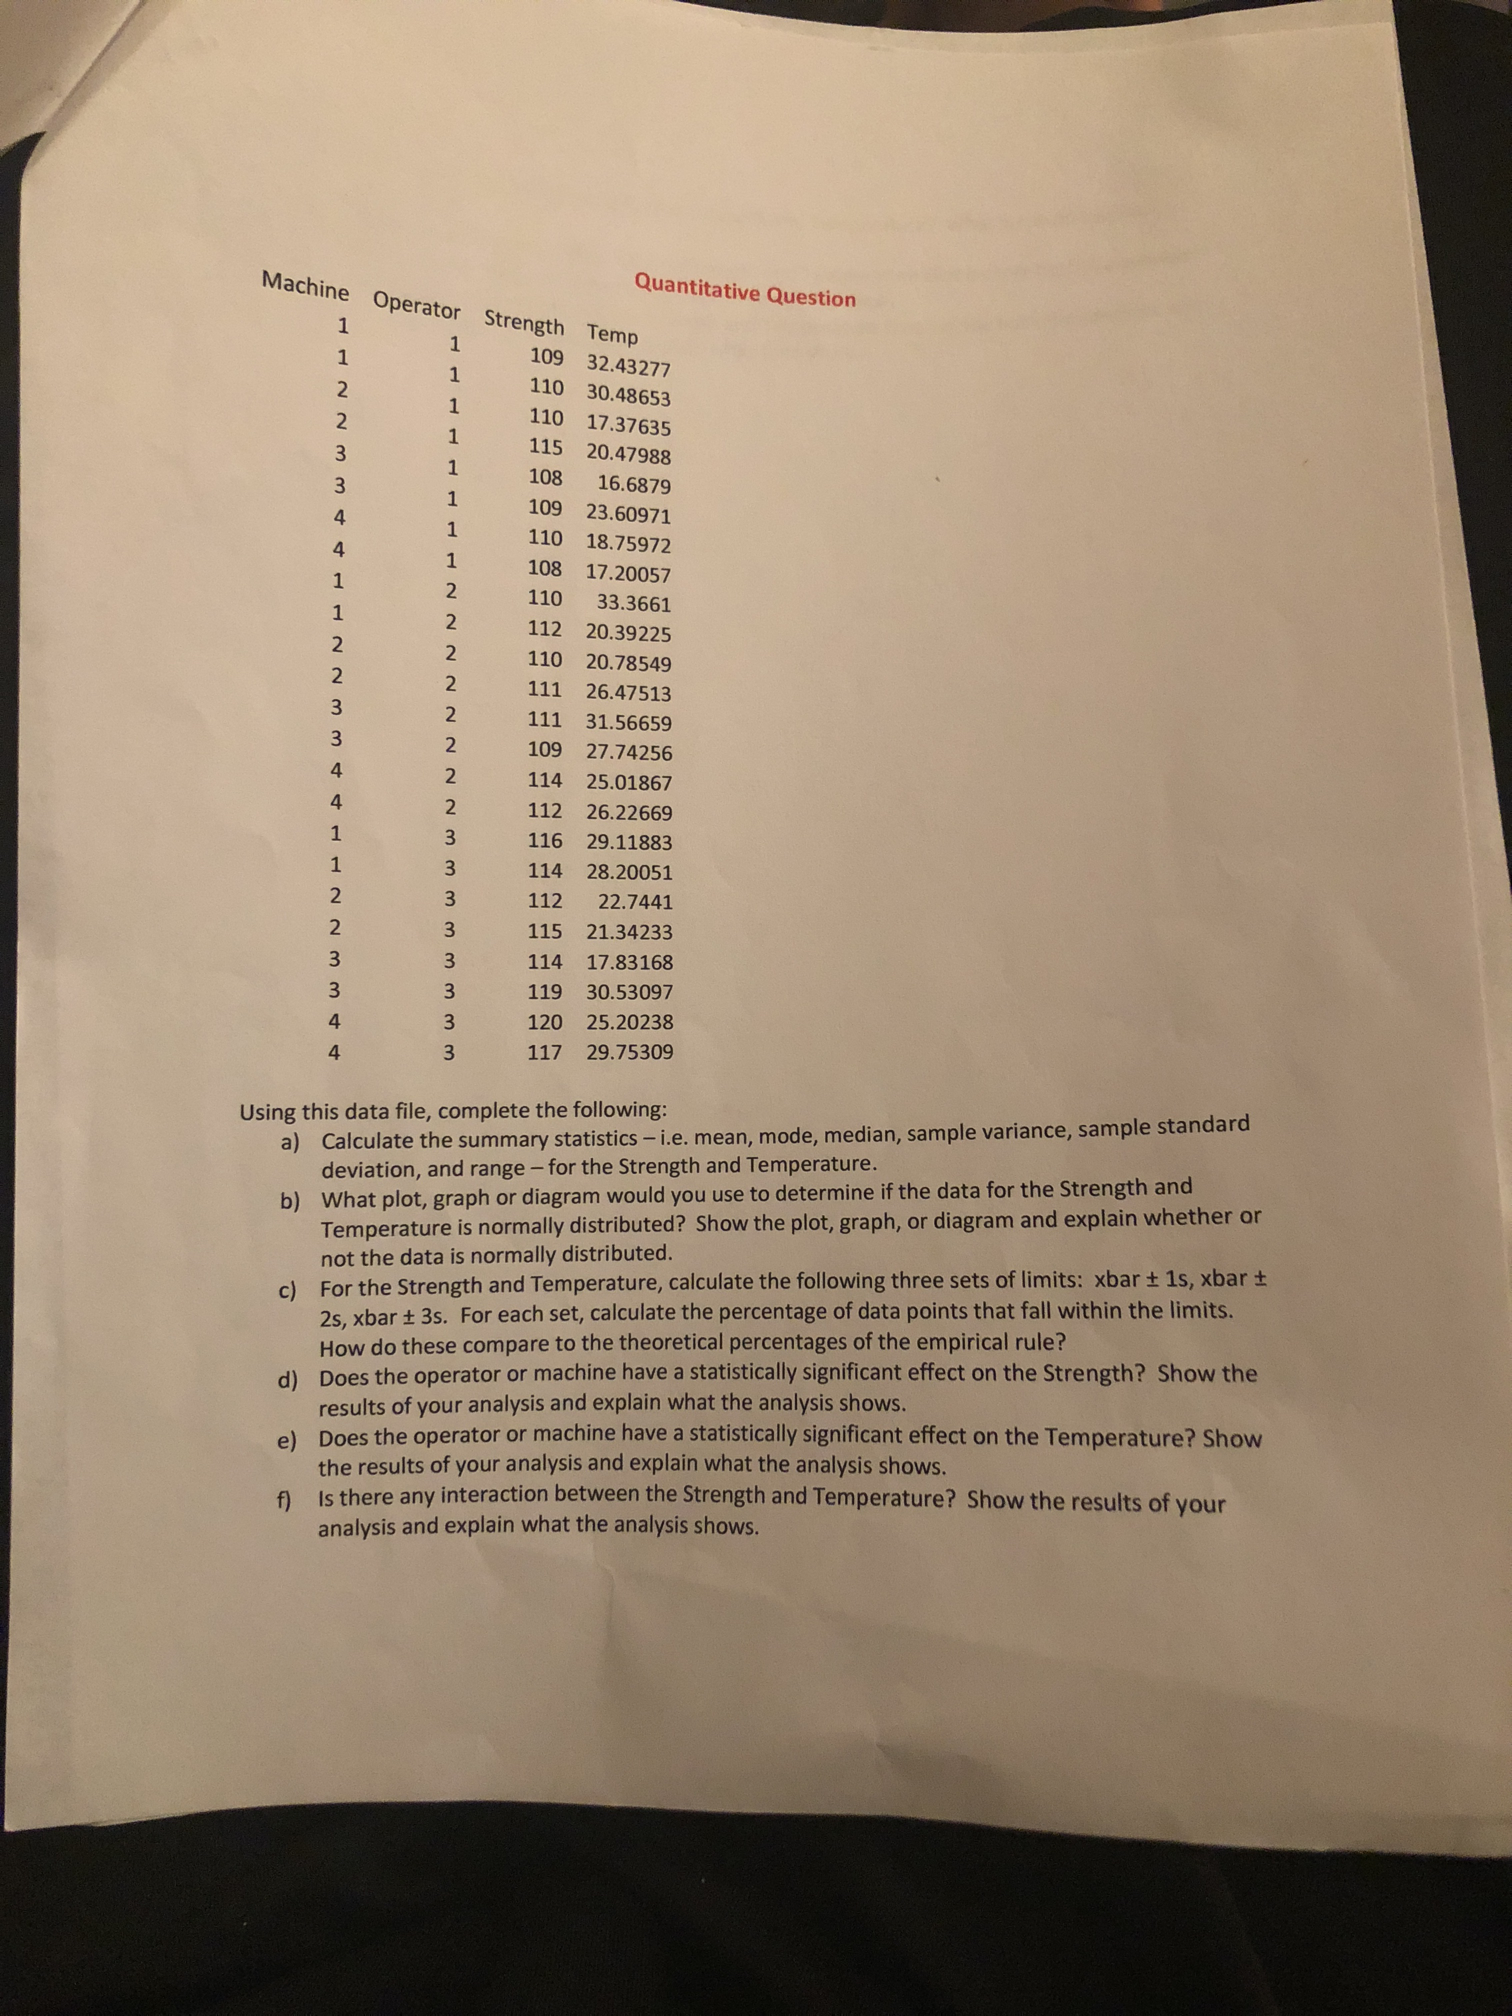
Machine Operator Quantitative Question Strength 109 110 32.43277 110 30.48653 115 17.37635 20.4798 108 109 16.6879 OWNNHHAAWWNN 110 23.60971 108 18.75972 110 17.20057 33.3661 112 20.39225 110 20.78549 111 26.47513 111 31.56659 109 27.74256 114 25.01867 w w ww WWWWNNNNNNNNH 112 26.22669 116 29.11883 114 28.20051 112 22.7441 AAWWNNHHAT 115 21.34233 114 17.83168 119 30.53097 120 25.20238 117 29.75309 Using this data file, complete the following: a) Calculate the summary statistics - i.e. mean, mode, median, sample variance, sample standard deviation, and range - for the Strength and Temperature. b) What plot, graph or diagram would you use to determine if the data for the Strength and Temperature is normally distributed? Show the plot, graph, or diagram and explain whether or not the data is normally distributed. c) For the Strength and Temperature, calculate the following three sets of limits: xbar + 1s, xbar 2s, xbar + 3s. For each set, calculate the percentage of data points that fall within the limits. How do these compare to the theoretical percentages of the empirical rule? d) Does the operator or machine have a statistically significant effect on the Strength? Show the results of your analysis and explain what the analysis shows. e) Does the operator or machine have a statistically significant effect on the Temperature? Show the results of your analysis and explain what the analysis shows. Is there any interaction between the Strength and Temperature? Show the results of your analysis and explain what the analysis shows.Machine Operator Quantitative Question Strength 109 110 32.43277 110 30.48653 115 17.37635 20.4798 108 109 16.6879 OWNNHHAAWWNN 110 23.60971 108 18.75972 110 17.20057 33.3661 112 20.39225 110 20.78549 111 26.47513 111 31.56659 109 27.74256 114 25.01867 w w ww WWWWNNNNNNNNH 112 26.22669 116 29.11883 114 28.20051 112 22.7441 AAWWNNHHAT 115 21.34233 114 17.83168 119 30.53097 120 25.20238 117 29.75309 Using this data file, complete the following: a) Calculate the summary statistics - i.e. mean, mode, median, sample variance, sample standard deviation, and range - for the Strength and Temperature. b) What plot, graph or diagram would you use to determine if the data for the Strength and Temperature is normally distributed? Show the plot, graph, or diagram and explain whether or not the data is normally distributed. c) For the Strength and Temperature, calculate the following three sets of limits: xbar + 1s, xbar 2s, xbar + 3s. For each set, calculate the percentage of data points that fall within the limits. How do these compare to the theoretical percentages of the empirical rule? d) Does the operator or machine have a statistically significant effect on the Strength? Show the results of your analysis and explain what the analysis shows. e) Does the operator or machine have a statistically significant effect on the Temperature? Show the results of your analysis and explain what the analysis shows. Is there any interaction between the Strength and Temperature? Show the results of your analysis and explain what the analysis shows
Step by Step Solution
There are 3 Steps involved in it

Get step-by-step solutions from verified subject matter experts