

Question: Make a bar graph to display the data in the table. rs) 5 Week Profit (thousands of de 1 21 2 15 3 26
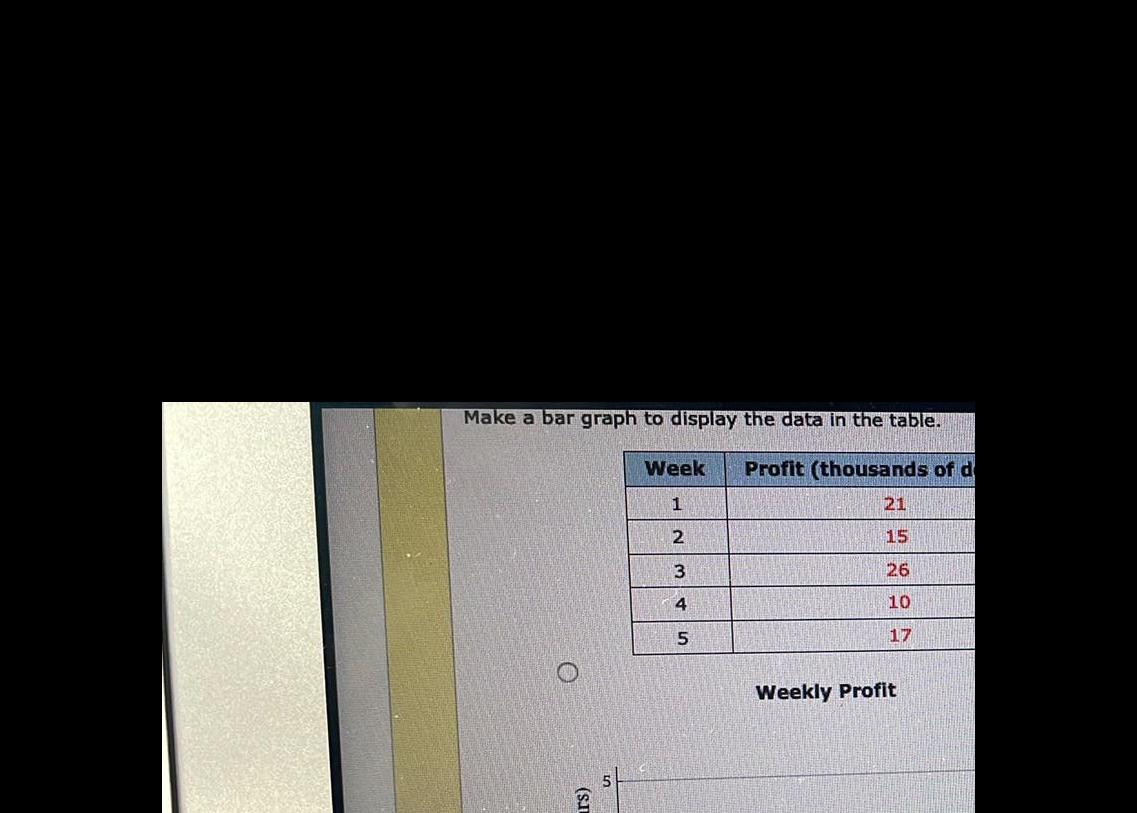
Make a bar graph to display the data in the table. rs) 5 Week Profit (thousands of de 1 21 2 15 3 26 4 10 5 17 Weekly Profit
Step by Step Solution
There are 3 Steps involved in it
1 Expert Approved Answer
Step: 1 Unlock

Question Has Been Solved by an Expert!
Get step-by-step solutions from verified subject matter experts
Step: 2 Unlock
Step: 3 Unlock