

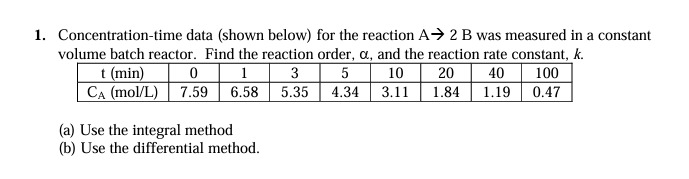
Question: Make a excel to use this problem with graphs included. Concentration - time data ( shown below ) for the reaction A 2 B was
Make a excel to use this problem with graphs included. Concentrationtime data shown below for the reaction was measured in a constant
volume batch reactor. Find the reaction order, and the reaction rate constant,
a Use the integral method
b Use the differential method.
Step by Step Solution
There are 3 Steps involved in it
1 Expert Approved Answer
Step: 1 Unlock

Question Has Been Solved by an Expert!
Get step-by-step solutions from verified subject matter experts
Step: 2 Unlock
Step: 3 Unlock