

Question: make a graph based on the information in the pictures The table below ShOWS aggregate demand and aggregate supply schedules in a hypothetical economy, Acadia.
make a graph based on the information in the pictures
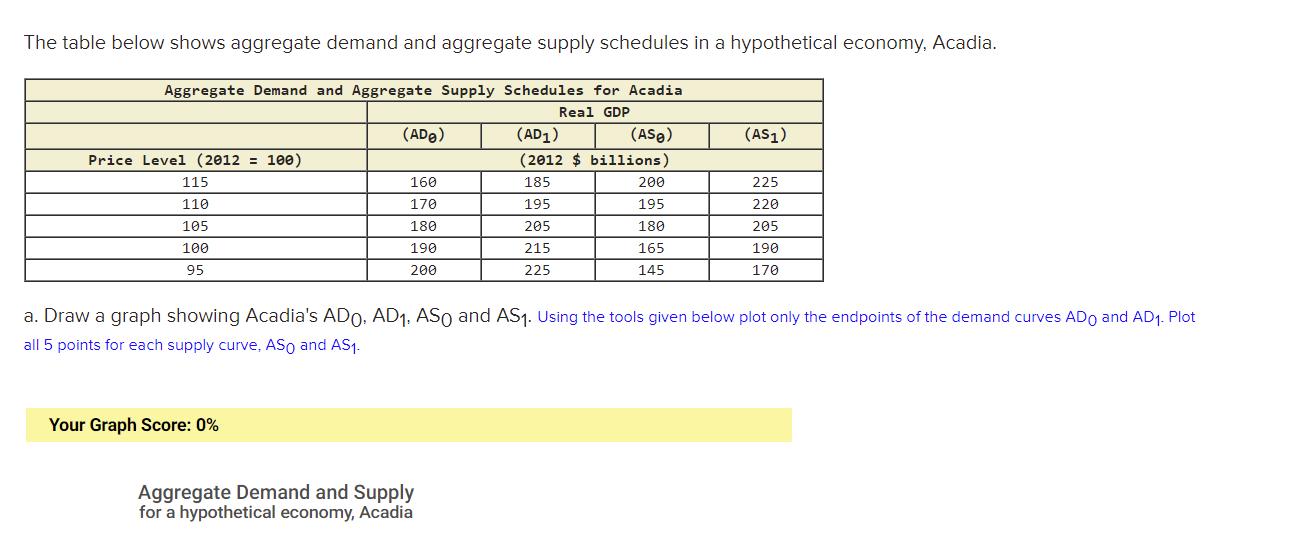
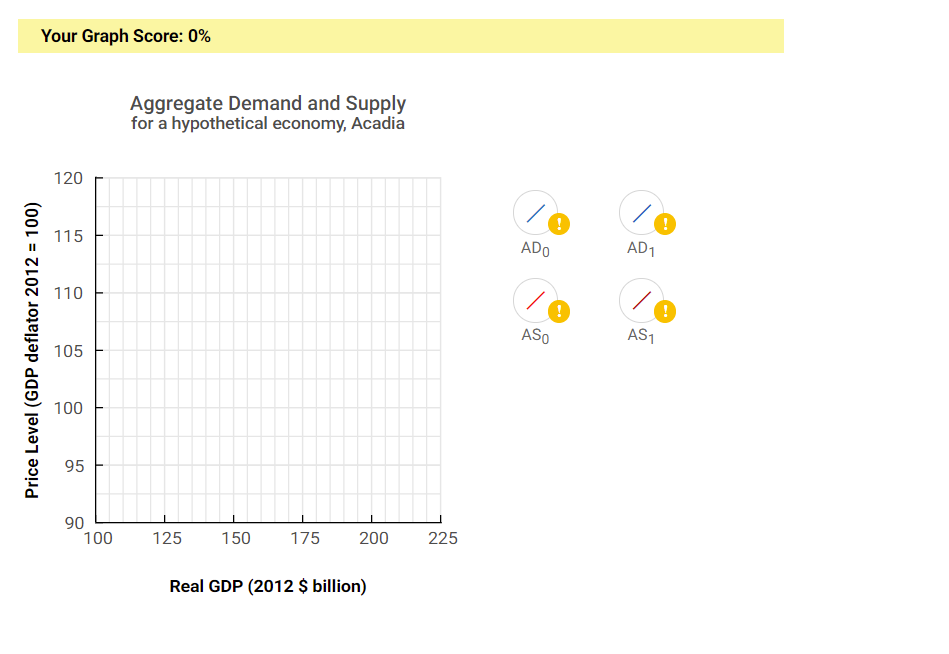
The table below ShOWS aggregate demand and aggregate supply schedules in a hypothetical economy, Acadia. Aggregate Demand and Aggregate Supply Schedules for Acadia a. Draw a graph showing Acadia's ADD, AD1. A50 and A51. Using the tools given below plot onlyr the endpoints ofthe demand curves ADO and AD1_ Plot all 5 points for each supply curve, A30 and A81. Your Graph Score: 0% Aggregate Demand and Supply for a hypothetical economy, Acadia
Step by Step Solution
There are 3 Steps involved in it
1 Expert Approved Answer
Step: 1 Unlock

Question Has Been Solved by an Expert!
Get step-by-step solutions from verified subject matter experts
Step: 2 Unlock
Step: 3 Unlock