

Question: The table below shows aggregate demand and aggregate supply schedules i n a hypothetical economy, Acadia. a . Draw a graph showing Acadia's A D
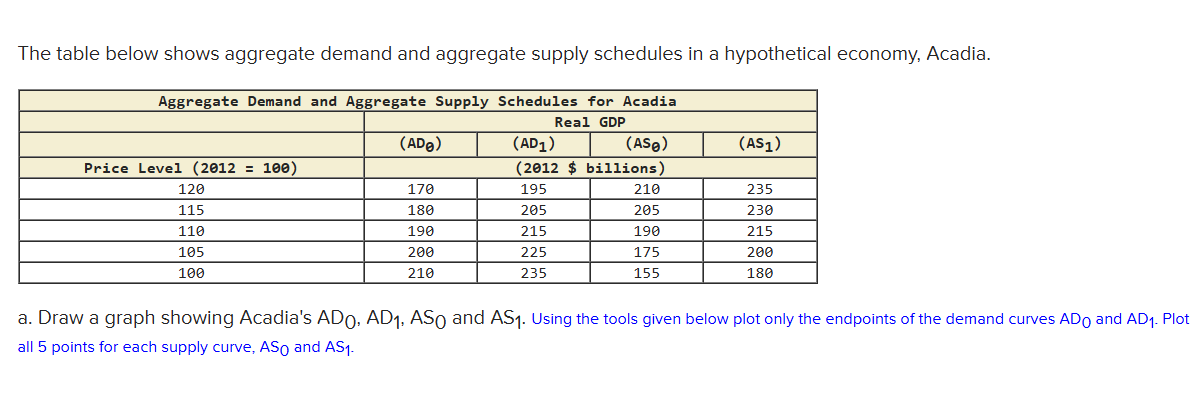
The table below shows aggregate demand and aggregate supply schedules a hypothetical economy, Acadia.
Draw a graph showing Acadia's and Using the tools given below plot only the endpoints the demand curves and Plot
all points for each supply curve, and Initially and are the relevant schedules.
The equilibrium price level
and equilibrium real output $
billion.
the price level then real output $ billion, real expenditures are $ while aggregate supply remains
Aggregate demand has undergone increase
a result the equilibrium price level
while aggregate demand remains
Aggregate supply has undergone a longrun increase
a result the equilibrium price level
and has a value
while equilibrium real output
and has a value $
billion.
Step by Step Solution
There are 3 Steps involved in it
1 Expert Approved Answer
Step: 1 Unlock

Question Has Been Solved by an Expert!
Get step-by-step solutions from verified subject matter experts
Step: 2 Unlock
Step: 3 Unlock