

Question: The table below shows aggregate demand and aggregate supply schedules in a hypothetical economy, Acadia. * Aggregate Demand and Aggregate Supply Schedules for Acadia Real
The table below shows aggregate demand and aggregate supply schedules in a hypothetical economy, Acadia.
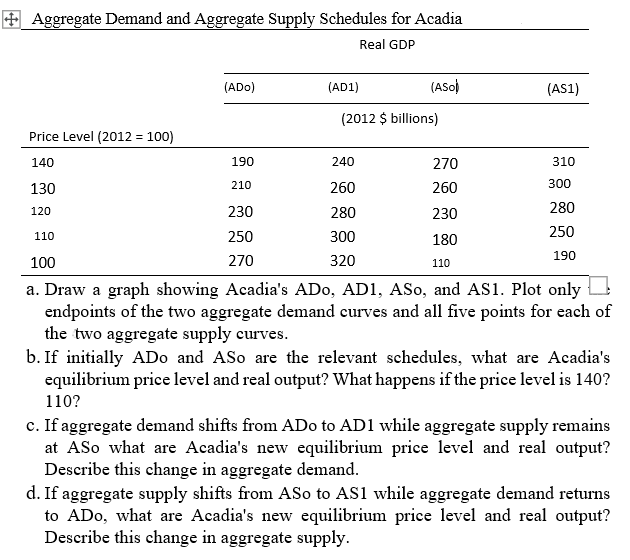
* Aggregate Demand and Aggregate Supply Schedules for Acadia Real GDP 140 190 240 310 210 300 120 110 190 110 (ADO) (AD1) (ASO) (AS1) (2012 $ billions) Price Level (2012 = 100) 270 130 260 260 230 280 230 280 250 300 250 180 100 270 320 a. Draw a graph showing Acadia's ADO, ADI, ASo, and ASi. Plot only endpoints of the two aggregate demand curves and all five points for each of the two aggregate supply curves. b. If initially ADo and ASo are the relevant schedules, what are Acadia's equilibrium price level and real output? What happens if the price level is 140? 110? c. If aggregate demand shifts from ADo to AD1 while aggregate supply remains at ASo what are Acadia's new equilibrium price level and real output? Describe this change in aggregate demand. d. If aggregate supply shifts from ASo to AS1 while aggregate demand returns to ADo, what are Acadia's new equilibrium price level and real output? Describe this change in aggregate supply
Step by Step Solution
There are 3 Steps involved in it

Get step-by-step solutions from verified subject matter experts