

Question: MAKE A MATLAB PROGRAM THAT WILL ANSWER THE QUESTION DESIGN A MATLAB PROGRAM THAT WILL SOLVE THIS PROBLEM The following diagram shows part of the
MAKE A MATLAB PROGRAM THAT WILL ANSWER THE QUESTION
DESIGN A MATLAB PROGRAM THAT WILL SOLVE THIS PROBLEM
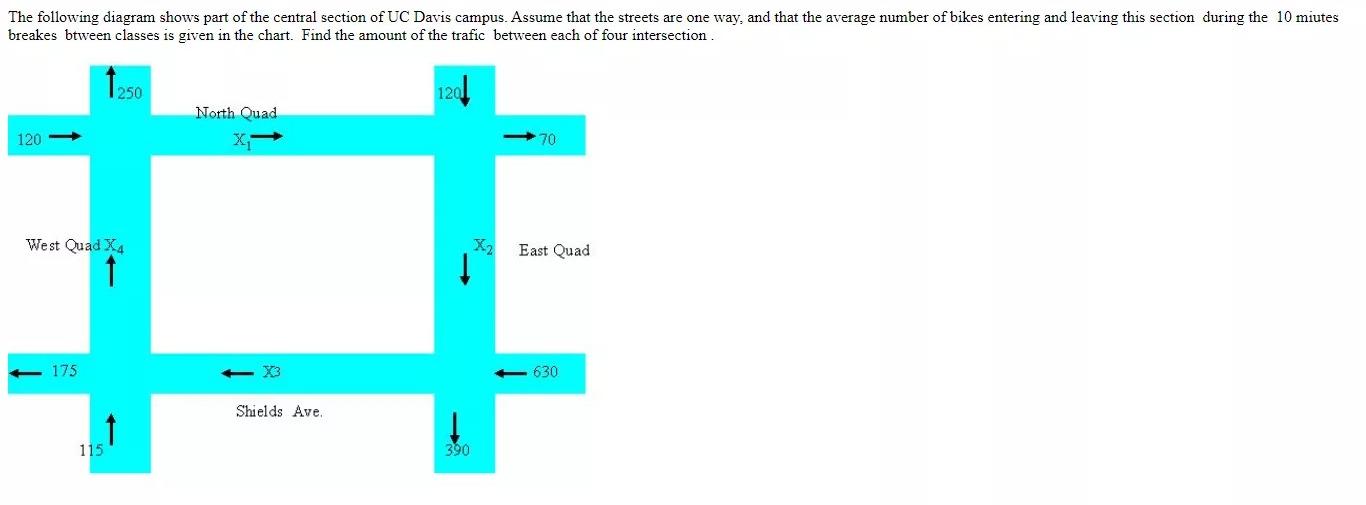
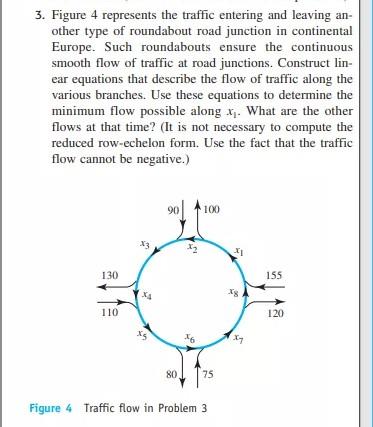
The following diagram shows part of the central section of UC Davis campus. Assume that the streets are one way, and that the average number of bikes entering and leaving this section during the 10 miutes breakes btween classes is given in the chart. Find the amount of the trafic between each of four intersection 250 1201 North Quad Xi 120 70 West Quad X4 X2 East Quad 175 630 Shields Ave, 115 390 3. Figure 4 represents the traffic entering and leaving an- other type of roundabout road junction in continental Europe. Such roundabouts ensure the continuous smooth flow of traffic at road junctions. Construct lin- ear equations that describe the flow of traffic along the various branches. Use these equations to determine the minimum flow possible along x. What are the other flows at that time? (It is not necessary to compute the reduced row-echelon form. Use the fact that the traffic flow cannot be negative.) 90 100 3 X1 130 155 110 120 16 1 80 75 Figure 4 Traffic flow in Problem 3 The following diagram shows part of the central section of UC Davis campus. Assume that the streets are one way, and that the average number of bikes entering and leaving this section during the 10 miutes breakes btween classes is given in the chart. Find the amount of the trafic between each of four intersection 250 1201 North Quad Xi 120 70 West Quad X4 X2 East Quad 175 630 Shields Ave, 115 390 3. Figure 4 represents the traffic entering and leaving an- other type of roundabout road junction in continental Europe. Such roundabouts ensure the continuous smooth flow of traffic at road junctions. Construct lin- ear equations that describe the flow of traffic along the various branches. Use these equations to determine the minimum flow possible along x. What are the other flows at that time? (It is not necessary to compute the reduced row-echelon form. Use the fact that the traffic flow cannot be negative.) 90 100 3 X1 130 155 110 120 16 1 80 75 Figure 4 Traffic flow in Problem 3
Step by Step Solution
There are 3 Steps involved in it

Get step-by-step solutions from verified subject matter experts