

Question: Make a plot of distance bs intensity for the light shining from the cup to the wall (plot the intensity on the y axis) .
Make a plot of distance bs intensity for the light shining from the cup to the wall (plot the intensity on the y axis) .
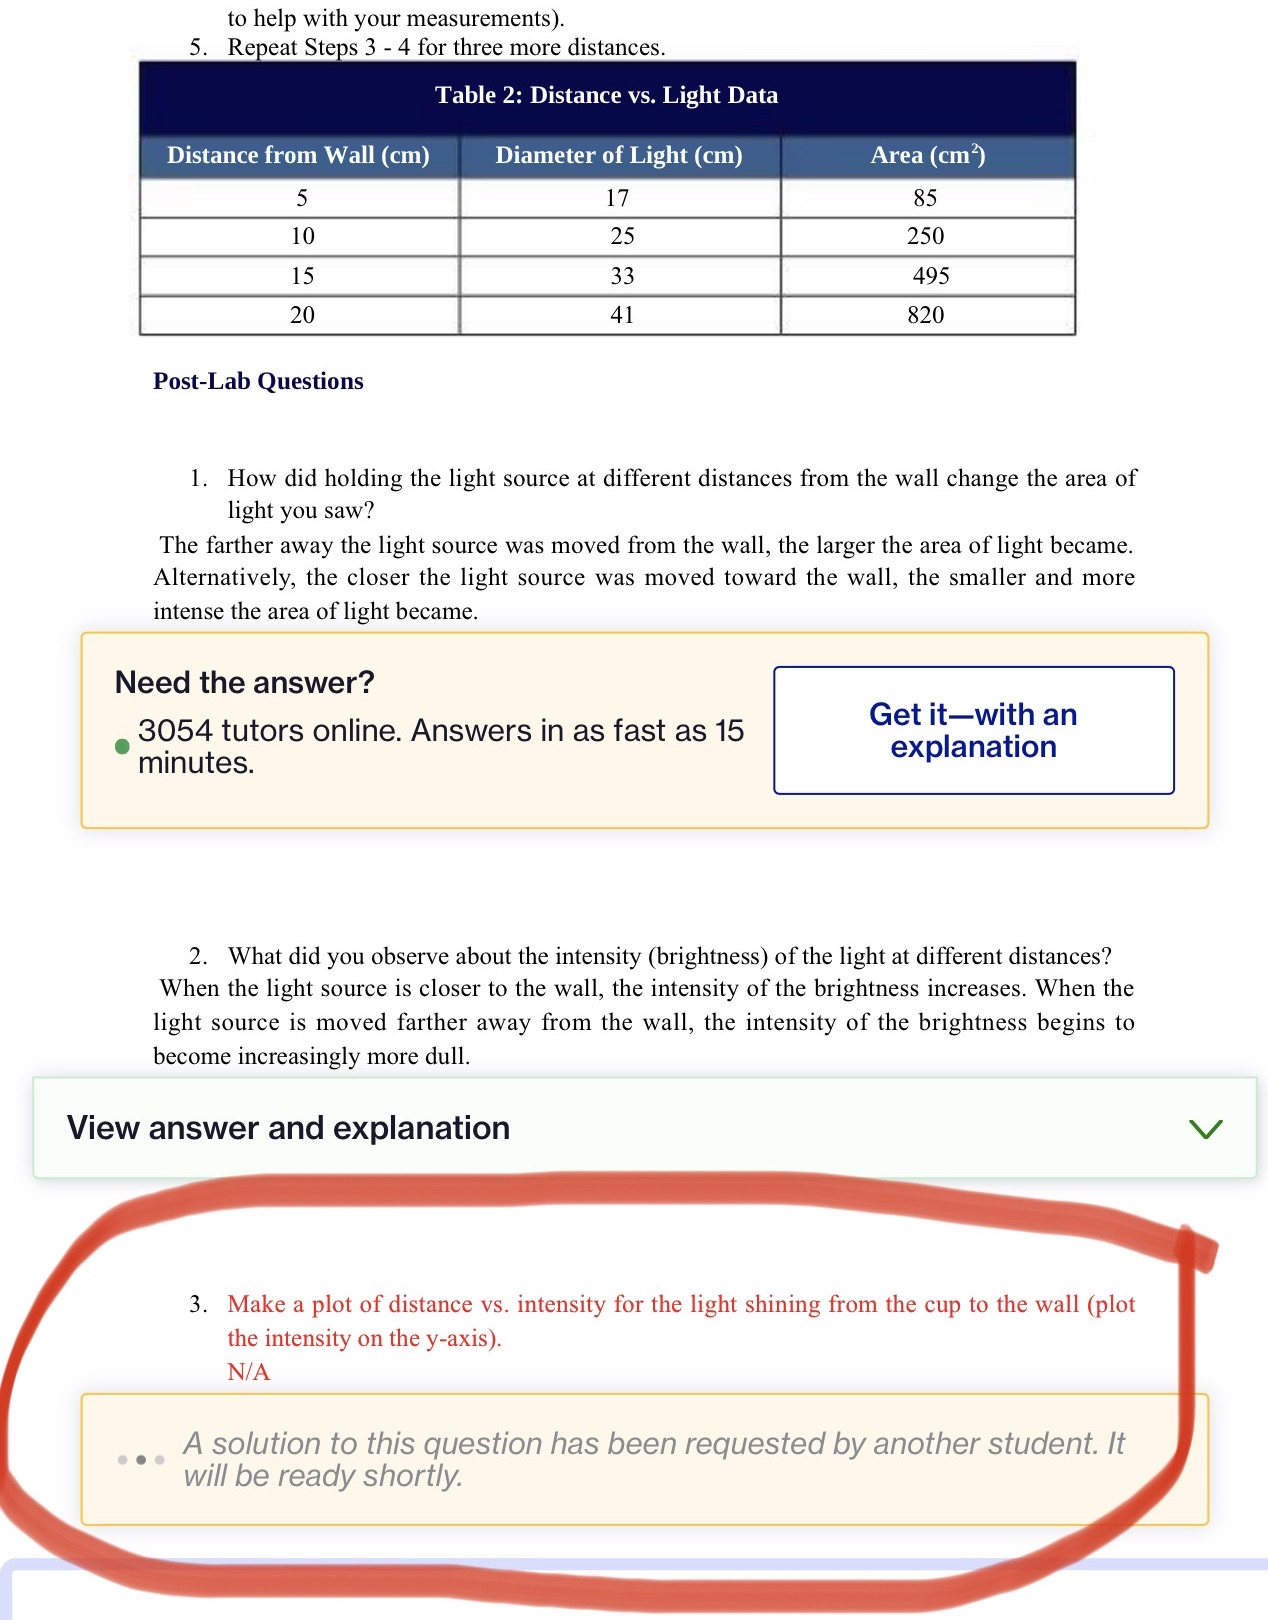
to help with your measurements). 5. Re eat Ste. s 3 - 4 for three more distances. Table 2: Distance vs. Light Data Distance from Wall (cm) Diameter of Light (cm) 17 25 33 PostLab Questions 1. How did holding the light source at different distances from the wall change the area of light you saw? The farther away the light source was moved from the wall, the larger the area of light became. Alternatively, the closer the light source was moved toward the wall, the smaller and more intense the area of light became. Need the answer? . 3054 tutors online. Answers in as fast as 15 minutes. Get itwith an explanation 2. What did you observe about the intensity (brightness) of the light at different distances? When the light source is closer to the wall, the intensity of the brightness increases. When the light source is moved farther away from the wall, the intensity of the brightness begins to become increasingly more dull. View answer and explanation v 3. Make a plot of distance vs. intensity for the light shining from the cup to the wall (plot the intensity on the y-axis). WA A solution to this question has been requested by another student. It will be ready shortly
Step by Step Solution
There are 3 Steps involved in it

Get step-by-step solutions from verified subject matter experts