

Question: Make a Range Control Chart. Labelling the X-axis Sample Number and the Y-axis Sample Range. The data above is not meant to be divided up;
Make a Range Control Chart. Labelling the X-axis "Sample Number" and the Y-axis "Sample Range". The data above is not meant to be divided up; it's one continuous string of data. Please show all calculations/functions.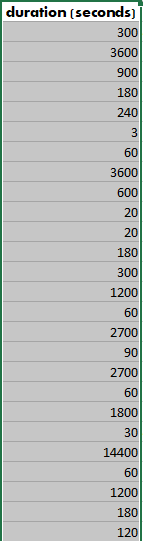
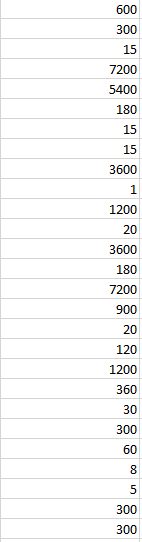
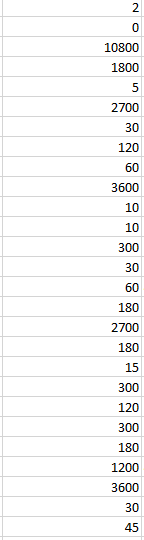
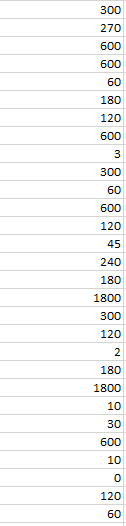
duration (seconds) 300 3600 900 180 240 3 60 3600 600 20 20 180 300 1200 60 2700 90 2700 60 1800 30 14400 60 1200 180 120
Step by Step Solution
★★★★★
3.38 Rating (148 Votes )
There are 3 Steps involved in it
1 Expert Approved Answer
Step: 1 Unlock

To create a Range Control Chart for the given data follow these steps Step 1 Calculate the ranges Ca... View full answer
Question Has Been Solved by an Expert!
Get step-by-step solutions from verified subject matter experts
Step: 2 Unlock
Step: 3 Unlock