

Question: make an analysis of the Baldwin firm performance by using financial and market-based measures How does the firm compare to its competitors as well as
make an analysis of the Baldwin firm performance by using financial and market-based measures
How does the firm compare to its competitors as well as the industry average?
What trends are evident over the past three to five years
Consider the perspectives of multiple stakeholders (internal and external). around 3 pages
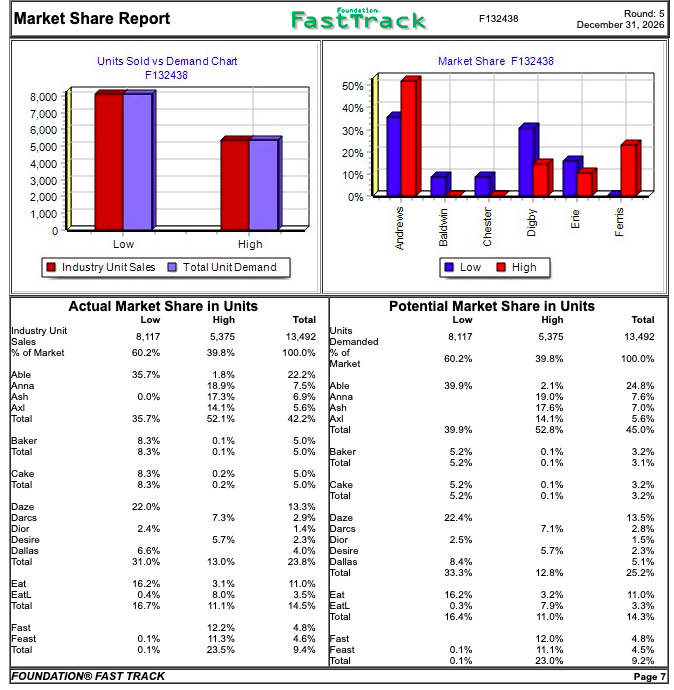
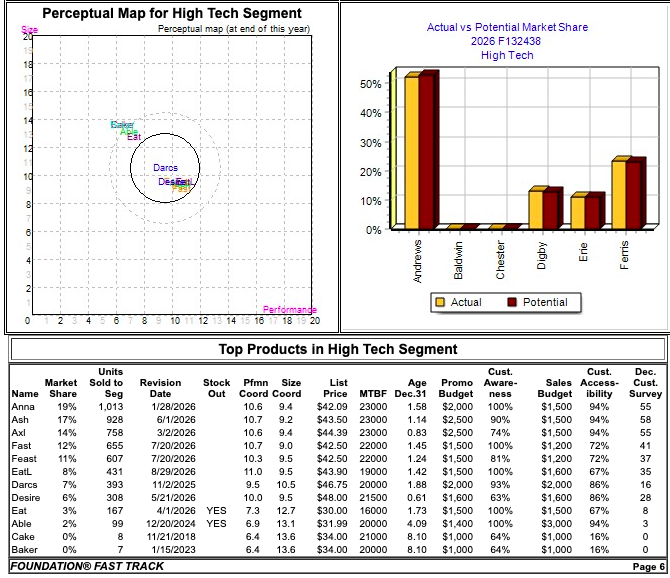
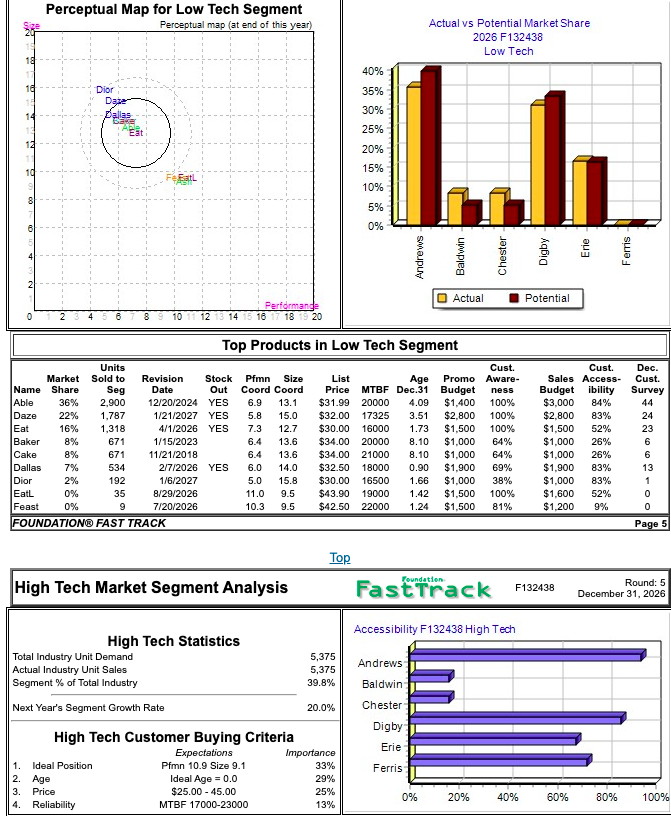
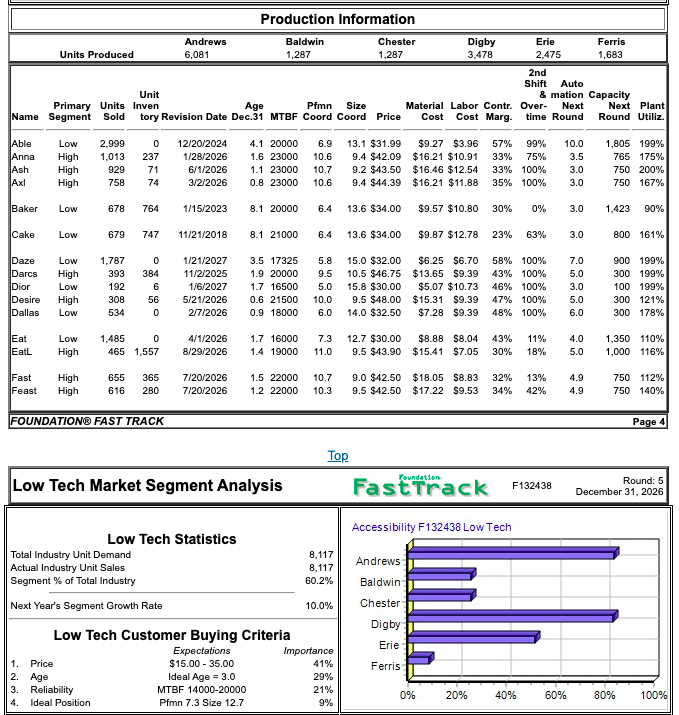
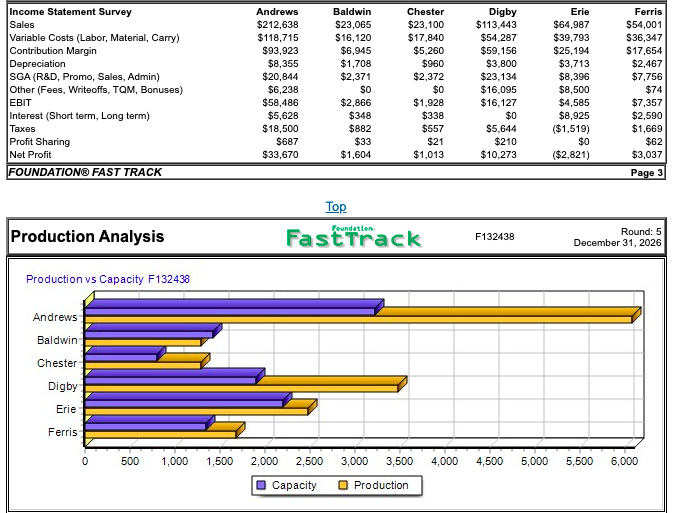
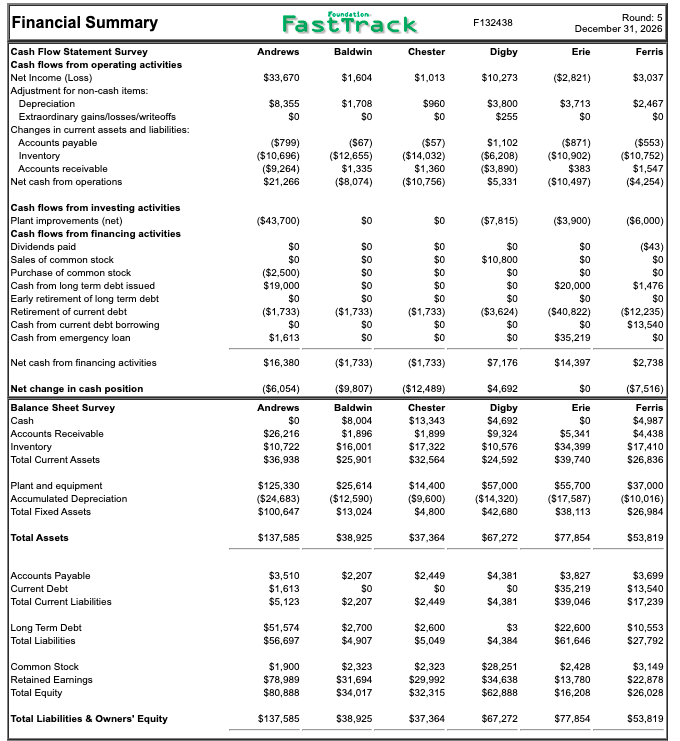
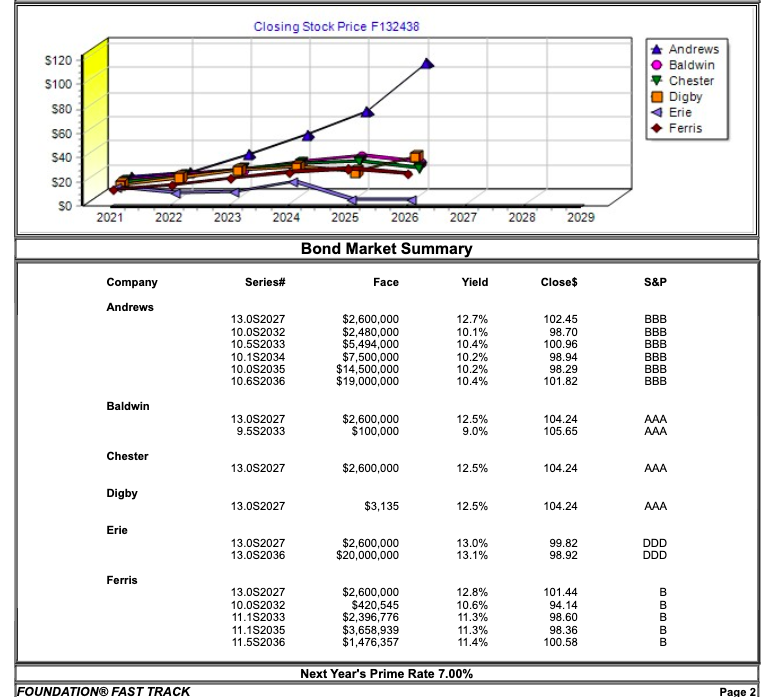
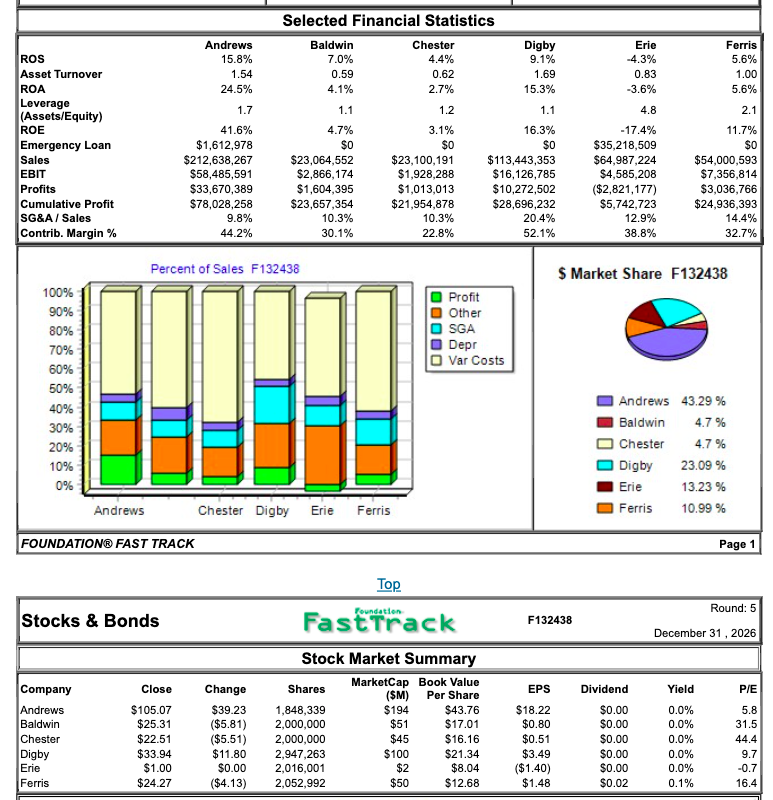
foundation Market Share Report Fast Track F132438 Round: 5 December 31, 2026 Market Share F132438 50% 40% 30% Units Sold vs Demand Chart F132438 8,000 7,000 6,000 5,000 4,000 3,000 2.000 1,000 0 Low High Industry Unit Sales Total Unit Demand 20% 10% 0% Andrews Baldwin Chester Fems Low High Actual Market Share in Units Low High Industry Unit Sales 8,117 5,375 % of Market 60.2% 39.8% Total 13,492 100.0% Potential Market Share in Units Low High 8,117 5,375 Total 13,492 Units Demanded % of Market 60.2% 39.8% 100.0% 35.7% 39.9% Able Anna Ash Axl Total 0.0% 1.8% 18.9% 17.3% 14.1% 52.1% 22.2% 7.5% 6.9% 5.6% 42.2% Able Anna Ash Axl Total 2.1% 19.0% 17.6% 14.1% 52.8% 24.8% 7.6% 7.0% 5.6% 45.0% 35.7% 39.9% Baker Total 8.3% 8.3% 0.1% 0.1% 5.0% 5.0% Baker Total 5.2% 5.2% 0.1% 0.1% 3.2% 3.1% Cake Total 8.3% 8.3% 0.2% 0.2% 5.0% 5.0% Cake Total 5.2% 5.2% 0.1% 0.1% 3.2% 3.2% 22.0% 7.3% 13.3% 2.9% 1.4% 22.4% 2.4% 7.1% Daze Darcs Dior Desire Dallas Total 5.7% 2.3% 2.5% 13.5% 2.8% 1.5% 2.3% 5.1% 25.2% Paze Parcs Dior Desire Dallas Total 6.6% 31.0% 5.7% 4.0% 23.8% 13.0% 8.4% 33.3% 12.8% Eat Eat Total 16.2% 0.4% 16.7% 3.1% 8.0% 11.1% 11.0% 3.5% 14.5% Eat EatL Total 16.2% 0.3% 16.4% 3.2% 7.9% 11.0% 11.0% 3.3% 14.3% Fast Feast Total 0.1% 0.1% 12.2% 11.3% 23.5% 4.8% 4.6% 9.4% Fast Feast Total 0.1% 0.1% 12.0% 11.1% 23.0% 4.8% 4.5% 9.2% Page 7 FOUNDATION FAST TRACK Perceptual Map for High Tech Segment Perceptual map (at end of this year) Actual vs Potential Market Share 2026 F132438 High Tech 50% 40% 30% 1 Daros Desitet 20% ca 10% 0% Andrews Baldwin Chester Ferns o Actual Potential Performande 16 18 19 20 0 2 10 11 12 13 14 1415189 Top Products in High Tech Segment Out 9.4 Units Market Sold to Revision Stock Name Share Seg Date Anna 19% 1,013 1/28/2026 Ash 17% 928 6/1/2026 Axl 14% 758 3/2/2026 Fast 12% 655 7/20/2026 Feast 11% 607 7/20/2026 EatL 8% 431 8/29/2026 Darcs 7% 393 11/2/2025 Desire 6% 308 5/21/2026 Eat 3% 167 4/1/2026 YES Able 2% 99 12/20/2024 YES Cake 0% 8 11/21/2018 Baker 0% 7 1/15/2023 FOUNDATION FAST TRACK Pfmn Size Coord Coord 10.6 10.7 9.2 10.6 9.4 10.7 9.0 10.3 9.5 11.0 9.5 10.5 10.0 9.5 7.3 12.7 6.9 13.1 6.4 13.6 6.4 13.6 Cust. List Age Promo Aware- Price MTBF Dec.31 Budget ness $42.09 23000 1.58 $2,000 100% $43.50 23000 1.14 $2,500 90% $44.39 23000 0.83 $2,500 74% $42.50 22000 1.45 $1,500 100% $42.50 22000 1.24 $1,500 81% $43.90 19000 1.42 $1,500 100% $46.75 20000 1.88 $2,000 93% $48.00 21500 0.61 $1,600 63% $30.00 16000 1.73 $1,500 100% $31.99 20000 4.09 $1,400 100% $34.00 21000 8.10 $1,000 64% $34.00 20000 8.10 $1,000 64% Cust. Sales Access- Budgetibility $1,500 94% $1,500 94% $1,500 94% $1,200 72% $1,200 72% $1,600 67% $2,000 86% $1,600 86% $1,500 67% $3,000 94% $1,000 16% $1,000 16% Dec. Cust. Survey 55 58 55 41 37 35 16 28 8 3 o 0 Page 6 9.5 Perceptual Map for Low Tech Segment Perceptual map (at end of this year) Actual vs Potential Market Share 2026 F132438 Low Tech 40% 35% Dior Daze Dallas 30% 25% 1. 20% 15% 10% 8 5% 0% Andrews Baldwin Chester Ferris Actual Potential Performance 16 17 18 19 20 0 8 10 12 14 Top Products in Low Tech Segment Units Market Sold to Revision Stock Name Share Seg Date Out Able 36% 2,900 12/20/2024 YES Daze 22% 1,787 1/21/2027 YES Eat 16% 1,318 4/1/2026 YES Baker 8% 671 1/15/2023 Cake 8% 671 11/21/2018 Dallas 7% 534 2/7/2026 YES Dior 2% 192 1/6/2027 EatL 0% 35 8/29/2026 Feast 0% 9 7/20/2026 FOUNDATION FAST TRACK Pfmn Size Coord Coord 6.9 13.1 5.8 15.0 7.3 12.7 6.4 13.6 6.4 13.6 6.0 14.0 5.0 15.8 11.0 9.5 10.3 9.5 Cust. List Age Promo Aware- Price MTBF Dec.31 Budget ness $31.99 20000 4.09 $1,400 100% $32.00 17325 3.51 $2,800 100% $30.00 16000 1.73 $1,500 100% $34.00 20000 8.10 $1,000 64% $34.00 21000 8.10 $1,000 64% $32.50 18000 0.90 $1,900 69% $30.00 16500 1.66 $1,000 38% $43.90 19000 1.42 $1,500 100% $42.50 22000 1.24 $1,500 81% Cust. Sales Access- Budgetibility $3,000 84% $2,800 83% $1,500 52% $1.000 26% $1,000 26% $1,900 83% $1,000 83% $1,600 52% $1,200 9% Dec. Cust. Survey 44 24 23 6 6 13 1 0 0 Page 5 Top Fast Track High Tech Market Segment Analysis F132438 Round: 5 December 31, 2026 Accessibility F132438 High Tech Andrews High Tech Statistics Total Industry Unit Demand Actual Industry Unit Sales Segment % of Total Industry Next Year's Segment Growth Rate 5,375 5,375 39.8% Baldwin 20.0% Chester Digby Erie High Tech Customer Buying Criteria Expectations Importance 1. Ideal Position Pfmn 10.9 Size 9.1 33% 2. Age Ideal Age = 0.0 29% 3. Price $25.00 - 45.00 25% 4. Reliability MTBF 17000-23000 13% Ferris 0% 20% 40% 60% 80% 100% Production Information Andrews Baldwin Chester Digby Erie Ferris Units Produced 6,081 1,287 1,287 3,478 2,475 1,683 2nd Shift Auto Unit & mation Capacity Primary Units Inven Age Pfmn Size Material Labor Contr. Over- Next Next Plant Name Segment Sold tory Revision Date Dec.31 MTBF Coord Coord Price Cost Cost Marg. time Round Round Utiliz. Able Anna Ash Axl Low High High High 2.999 1,013 929 758 0 237 71 74 12/20/2024 1/28/2026 6/1/2026 3/2/2026 4.1 20000 1.6 23000 1.1 23000 0.8 23000 6.9 10.6 10.7 10.6 13.1 $31.99 9.4 $42.09 9.2 $43.50 9.4 $44.39 $9.27 $3.96 $16.21 $10.91 $16.46 $12.54 $16.21 $11.88 57% 99% 33% 75% 33% 100% 35% 100% 10.0 3.5 3.0 3.0 1,805 199% 765 175% 750 200% 750 167% Baker Low 678 764 1/15/2023 8.1 20000 6.4 13.6 $34.00 $9.57 $10.80 30% 0% 3.0 1,423 90% Cake Low 679 747 11/21/2018 8.1 21000 6.4 13.6 $34.00 $9.87 $12.78 23% 63% 3.0 800 161% Daze Darcs Dior Desire Dallas Low High Low High Low 1,787 393 192 308 534 0 384 6 56 0 1/21/2027 11/2/2025 1/6/2027 5/21/2026 2/7/2026 3.5 17325 1.9 20000 1.7 16500 0.6 21500 0.9 18000 5.8 9.5 5.0 10.0 6.0 15.0 $32.00 $6.25 $6.70 10.5 $46.75 $13.65 $9.39 15.8 $30.00 $5.07 $10.73 9.5 $48.00 $15.31 $9.39 14.0 $32.50 $7.28 $9.39 58% 100% 43% 100% 46% 100% 47% 100% 48% 100% 7.0 5.0 3.0 5.0 6.0 900 199% 300 199% 100 199% 300 121% 300 178% Eat EatL Low High 1,485 0 465 1,557 4/1/2026 8/29/2026 1.7 16000 1.4 19000 73 11.0 12.7 $30.00 9.5 $43.90 $8.88 $8.04 $15.41 $7.05 43% 30% 11% 18% 4.0 5.0 1,350 110% 1,000 116% 4.9 Fast Feast High High 655 616 365 280 7/20/2026 7/20/2026 1.5 22000 1.2 22000 10.7 10.3 9.0 $42.50 $18.05 $8.83 9.5 $42.50 $17.22 $9.53 32% 34% 13% 42% 750 112% 750 140% 4.9 FOUNDATION FAST TRACK Page 4 Top Fast Track foundation Low Tech Market Segment Analysis F132438 Round: 5 December 31, 2026 Accessibility F132438 Low Tech Andrews Low Tech Statistics Total Industry Unit Demand Actual Industry Unit Sales Segment % of Total Industry Next Year's Segment Growth Rate 8,117 8,117 60.2% Baldwin Chester 10.0% Low Tech Customer Buying Criteria Expectations Importance 1. Price $15.00 - 35.00 41% 2. Age Ideal Age = 3.0 29% 3. Reliability MTBF 14000-20000 21% 4. Ideal Position Pfmn 7.3 Size 12.7 9% Digby Erie Ferris 0% 20% 40% 60% 80% 100% Income Statement Survey Sales Variable Costs (Labor, Material, Carry) Contribution Margin Depreciation SGA (R&D, Promo, Sales, Admin) Other (Fees, Writeoffs, TOM, Bonuses) EBIT Interest (Short term, Long term) Taxes Profit Sharing Net Profit FOUNDATION FAST TRACK Andrews $212,638 $118,715 $93,923 $8,355 $20,844 $6,238 $58,486 $5,628 $18,500 $687 $33,670 Baldwin $23,065 $16,120 $6,945 $1,708 $2,371 SO $2,866 $348 $882 $33 $1,604 Chester $23,100 $17,840 $5,260 $960 $2,372 $0 $1,928 $338 $557 $21 $1,013 Digby $113,443 $54,287 $59,156 $3,800 $23,134 $16.095 $16,127 $0 $5,644 $210 $10,273 Erie $64,987 $39,793 $25,194 $3,713 $8,396 $8,500 $4,585 $8,925 ($1,519) $0 ($2,821) Ferris $54,001 $36,347 $17.654 $2,467 $7,756 $74 $7,357 $2,590 $1,669 $62 $3,037 Page 3 Top Fast Track foundation Production Analysis F132438 Round: 5 December 31, 2026 Production vs Capacity F132438 Andrews Baldwin Chester Digby Erie Ferris 0 500 1,000 1,500 2.000 2,500 3,000 3,500 4,000 4,500 5,000 5,500 6,000 Capacity O Production F132438 Round: 5 December 31, 2026 Fast Track Andrews Baldwin Chester $33,670 $1,604 $1,013 Digby Erie Ferris $10,273 ($2,821) $3,037 Financial Summary Cash Flow Statement Survey Cash flows from operating activities Net Income (Loss) Adjustment for non-cash items: Depreciation Extraordinary gains/losses/writeoffs Changes in current assets and liabilities: Accounts payable Inventory Accounts receivable Net cash from operations $8,355 $0 $1,708 SO $960 $0 $3,800 $255 $3,713 $0 $2,467 $0 ($799) ($10,696) ($9,264) $21,266 ($67) ($12,655) $1,335 ($8,074) ($57) ($14,032) $1,360 ($10,756) $1.102 ($6,208) ($3,890) $5,331 ($871) ($10,902) $383 ($10,497) ($553) ($10,752) $1,547 ($4,254) ($43,700) SO $0 $0 ($7,815) ($3,900) ($6,000) Cash flows from investing activities Plant improvements (net) Cash flows from financing activities Dividends paid Sales of common stock Purchase of common stock Cash from long term debt issued Early retirement of long term debt Retirement of current debt Cash from current debt borrowing Cash from emergency loan Net cash from financing activities Net change in cash position Balance Sheet Survey Cash Accounts Receivable Inventory Total Current Assets $0 $0 ($2,500) $19.000 $0 ($1,733) $0 $1,613 SO SO SO SO SO ($1,733) SO SO $0 $0 $0 $0 $0 ($1,733) $0 $0 $0 $10,800 $0 $0 $0 ($3,624) $0 $0 $0 $0 $0 $20,000 $0 ($40,822) $0 $35,219 (543) $0 $0 $1,476 $0 ($12,235) $13,540 $0 $16,380 ($1,733) ($1,733) $7,176 $14,397 $2,738 ($6,054) ($9,807) ($12,489) $4,692 $0 Andrews $0 $26,216 $10,722 $36,938 Baldwin $8,004 $1,896 $16,001 $25,901 Chester $13,343 $1,899 $17,322 $32,564 Digby $4,692 $9,324 $10,576 $24,592 Erie $0 $5,341 $34,399 $39,740 ($7,516) Ferris $4,987 $4,438 $17.410 $26,836 Plant and equipment Accumulated Depreciation Total Fixed Assets $125,330 ($24,683) $100,647 $25,614 ($12,590) $13,024 $14,400 ($9,600) $4,800 $57.000 ($14,320) $42.680 $55,700 ($17,587) $38,113 $37,000 ($10,016) $26,984 Total Assets $137,585 $38,925 $37,364 $67 272 $77,854 $53,819 Accounts Payable Current Debt Total Current Liabilities $3,510 $1,613 $5,123 $2,207 SO $2,207 $2.449 $0 $2,449 $4,381 $0 $4,381 $3,827 $35,219 $39,046 $3,699 $13,540 $17,239 Long Term Debt Total Liabilities $51,574 $56,697 $2,700 $4,907 $2,600 $5,049 $3 $4,384 $22,600 $61,646 $10,553 $27,792 Common Stock Retained Earnings Total Equity $1,900 $78,989 $80,888 $2,323 $31,694 $34,017 $2,323 $29,992 $32,315 $28.251 $34.638 $62,888 $2,428 $13,780 $16,208 $3,149 $22,878 $26,028 Total Liabilities & Owners' Equity $137,585 $38.925 $37,364 $67,272 $77,854 $53,819 Closing Stock Price F132438 $120 $100 # Andrews Baldwin Chester Digby Erie Ferris $80 $60 $40 $20 SO 2021 2022 2023 2024 2025 2026 2027 2028 2029 Bond Market Summary Company Series# Face Yield Close$ S&P Andrews 13.0S2027 10.0S2032 10.582033 10.1S2034 10.082035 10.6S2036 $2,600,000 $2,480,000 $5,494,000 $7,500,000 $14,500,000 $19,000,000 12.7% 10.1% 10.4% 10.2% 10.2% 10.4% 102.45 98.70 100.96 98.94 98.29 101.82 BBB BBB BBB BBB BBB BBB Baldwin 13.0S2027 9.552033 $2,600,000 $100,000 12.5% 9.0% 104.24 105.65 AAA AAA Chester 13.0S2027 $2,600,000 12.5% 104.24 AAA Digby 13.0S2027 $3,135 12.5% 104.24 AAA Erie 13.0S2027 13.082036 $2,600,000 $20,000,000 13.0% 13.1% 99.82 98.92 DDD DDD Ferris 13.0S2027 10.0S2032 11.1S2033 11.1S2035 11.552036 $2,600,000 $420,545 $2,396,776 $3,658,939 $1,476,357 12.8% 10.6% 11.3% 11.3% 11.4% 101.44 94.14 98.60 98.36 100.58 B B B B B Next Year's Prime Rate 7.00% FOUNDATION FAST TRACK Page 2 Selected Financial Statistics Erie Andrews 15.8% 1.54 24.5% Baldwin 7.0% 0.59 4.1% Chester 4.4% 0.62 2.7% Digby 9.1% 1.69 15.3% -4.3% 0.83 -3.6% Ferris 5.6% 1.00 5.6% 1.7 1.1 1.2 1.1 4.8 2.1 ROS Asset Turnover ROA Leverage (Assets/Equity) ROE Emergency Loan Sales EBIT Profits Cumulative Profit SG&A/ Sales Contrib. Margin % 41.6% $1,612,978 $212,638,267 $58,485,591 $33,670,389 $78,028,258 9.8% 44.2% 4.7% $0 $23,064,552 $2,866,174 $1,604,395 $23,657,354 10.3% 30.1% 3.1% $0 $23,100,191 $1,928,288 $1,013,013 $21,954,878 10.3% 22.8% 16.3% $O $113,443,353 $16,126,785 $10,272,502 $28,696,232 20.4% 52.1% -17.4% $35,218,509 $64,987,224 $4,585,208 ($2,821,177) $5,742,723 12.9% 38.8% 11.7% $0 $54,000,593 $7,356,814 $3,036,766 $24,936,393 14.4% 32.7% Percent of Sales F132438 $ Market Share F132438 Profit Other O SGA Depr Var Costs 100% 90% 80% 70% 60% 50% 40% 30% 20% 10% 0% Andrews 43.29 % Baldwin 4.7% Chester 4.7 % Digby 23.09% Erie 13.23 % Ferris 10.99 % Andrews Chester Digby Erie Ferris FOUNDATION FAST TRACK Page 1 Top Foundation Round: 5 Stocks & Bonds Fast Track F132438 December 31, 2026 Close EPS Dividend Yield P/E Company Andrews Baldwin Chester Digby Erie Ferris - $105.07 $25.31 $22.51 $33.94 $1.00 $24.27 Stock Market Summary MarketCap Book Value Shares ($M) Per Share 1,848,339 $194 $43.76 2,000,000 $51 $17.01 2,000,000 $45 $16.16 2,947,263 $100 $21.34 2,016,001 $2 $8.04 2,052,992 $50 $12.68 Change $39.23 ($5.81) ($5.51) $11.80 $0.00 ($4.13) $18.22 $0.80 $0.51 $3.49 ($1.40) $1.48 $0.00 $0.00 $0.00 $0.00 $0.00 $0.02 0.0% 0.0% 0.0% 0.0% 0.0% 0.1% 5.8 31.5 44.4 9.7 -0.7 16.4 foundation Market Share Report Fast Track F132438 Round: 5 December 31, 2026 Market Share F132438 50% 40% 30% Units Sold vs Demand Chart F132438 8,000 7,000 6,000 5,000 4,000 3,000 2.000 1,000 0 Low High Industry Unit Sales Total Unit Demand 20% 10% 0% Andrews Baldwin Chester Fems Low High Actual Market Share in Units Low High Industry Unit Sales 8,117 5,375 % of Market 60.2% 39.8% Total 13,492 100.0% Potential Market Share in Units Low High 8,117 5,375 Total 13,492 Units Demanded % of Market 60.2% 39.8% 100.0% 35.7% 39.9% Able Anna Ash Axl Total 0.0% 1.8% 18.9% 17.3% 14.1% 52.1% 22.2% 7.5% 6.9% 5.6% 42.2% Able Anna Ash Axl Total 2.1% 19.0% 17.6% 14.1% 52.8% 24.8% 7.6% 7.0% 5.6% 45.0% 35.7% 39.9% Baker Total 8.3% 8.3% 0.1% 0.1% 5.0% 5.0% Baker Total 5.2% 5.2% 0.1% 0.1% 3.2% 3.1% Cake Total 8.3% 8.3% 0.2% 0.2% 5.0% 5.0% Cake Total 5.2% 5.2% 0.1% 0.1% 3.2% 3.2% 22.0% 7.3% 13.3% 2.9% 1.4% 22.4% 2.4% 7.1% Daze Darcs Dior Desire Dallas Total 5.7% 2.3% 2.5% 13.5% 2.8% 1.5% 2.3% 5.1% 25.2% Paze Parcs Dior Desire Dallas Total 6.6% 31.0% 5.7% 4.0% 23.8% 13.0% 8.4% 33.3% 12.8% Eat Eat Total 16.2% 0.4% 16.7% 3.1% 8.0% 11.1% 11.0% 3.5% 14.5% Eat EatL Total 16.2% 0.3% 16.4% 3.2% 7.9% 11.0% 11.0% 3.3% 14.3% Fast Feast Total 0.1% 0.1% 12.2% 11.3% 23.5% 4.8% 4.6% 9.4% Fast Feast Total 0.1% 0.1% 12.0% 11.1% 23.0% 4.8% 4.5% 9.2% Page 7 FOUNDATION FAST TRACK Perceptual Map for High Tech Segment Perceptual map (at end of this year) Actual vs Potential Market Share 2026 F132438 High Tech 50% 40% 30% 1 Daros Desitet 20% ca 10% 0% Andrews Baldwin Chester Ferns o Actual Potential Performande 16 18 19 20 0 2 10 11 12 13 14 1415189 Top Products in High Tech Segment Out 9.4 Units Market Sold to Revision Stock Name Share Seg Date Anna 19% 1,013 1/28/2026 Ash 17% 928 6/1/2026 Axl 14% 758 3/2/2026 Fast 12% 655 7/20/2026 Feast 11% 607 7/20/2026 EatL 8% 431 8/29/2026 Darcs 7% 393 11/2/2025 Desire 6% 308 5/21/2026 Eat 3% 167 4/1/2026 YES Able 2% 99 12/20/2024 YES Cake 0% 8 11/21/2018 Baker 0% 7 1/15/2023 FOUNDATION FAST TRACK Pfmn Size Coord Coord 10.6 10.7 9.2 10.6 9.4 10.7 9.0 10.3 9.5 11.0 9.5 10.5 10.0 9.5 7.3 12.7 6.9 13.1 6.4 13.6 6.4 13.6 Cust. List Age Promo Aware- Price MTBF Dec.31 Budget ness $42.09 23000 1.58 $2,000 100% $43.50 23000 1.14 $2,500 90% $44.39 23000 0.83 $2,500 74% $42.50 22000 1.45 $1,500 100% $42.50 22000 1.24 $1,500 81% $43.90 19000 1.42 $1,500 100% $46.75 20000 1.88 $2,000 93% $48.00 21500 0.61 $1,600 63% $30.00 16000 1.73 $1,500 100% $31.99 20000 4.09 $1,400 100% $34.00 21000 8.10 $1,000 64% $34.00 20000 8.10 $1,000 64% Cust. Sales Access- Budgetibility $1,500 94% $1,500 94% $1,500 94% $1,200 72% $1,200 72% $1,600 67% $2,000 86% $1,600 86% $1,500 67% $3,000 94% $1,000 16% $1,000 16% Dec. Cust. Survey 55 58 55 41 37 35 16 28 8 3 o 0 Page 6 9.5 Perceptual Map for Low Tech Segment Perceptual map (at end of this year) Actual vs Potential Market Share 2026 F132438 Low Tech 40% 35% Dior Daze Dallas 30% 25% 1. 20% 15% 10% 8 5% 0% Andrews Baldwin Chester Ferris Actual Potential Performance 16 17 18 19 20 0 8 10 12 14 Top Products in Low Tech Segment Units Market Sold to Revision Stock Name Share Seg Date Out Able 36% 2,900 12/20/2024 YES Daze 22% 1,787 1/21/2027 YES Eat 16% 1,318 4/1/2026 YES Baker 8% 671 1/15/2023 Cake 8% 671 11/21/2018 Dallas 7% 534 2/7/2026 YES Dior 2% 192 1/6/2027 EatL 0% 35 8/29/2026 Feast 0% 9 7/20/2026 FOUNDATION FAST TRACK Pfmn Size Coord Coord 6.9 13.1 5.8 15.0 7.3 12.7 6.4 13.6 6.4 13.6 6.0 14.0 5.0 15.8 11.0 9.5 10.3 9.5 Cust. List Age Promo Aware- Price MTBF Dec.31 Budget ness $31.99 20000 4.09 $1,400 100% $32.00 17325 3.51 $2,800 100% $30.00 16000 1.73 $1,500 100% $34.00 20000 8.10 $1,000 64% $34.00 21000 8.10 $1,000 64% $32.50 18000 0.90 $1,900 69% $30.00 16500 1.66 $1,000 38% $43.90 19000 1.42 $1,500 100% $42.50 22000 1.24 $1,500 81% Cust. Sales Access- Budgetibility $3,000 84% $2,800 83% $1,500 52% $1.000 26% $1,000 26% $1,900 83% $1,000 83% $1,600 52% $1,200 9% Dec. Cust. Survey 44 24 23 6 6 13 1 0 0 Page 5 Top Fast Track High Tech Market Segment Analysis F132438 Round: 5 December 31, 2026 Accessibility F132438 High Tech Andrews High Tech Statistics Total Industry Unit Demand Actual Industry Unit Sales Segment % of Total Industry Next Year's Segment Growth Rate 5,375 5,375 39.8% Baldwin 20.0% Chester Digby Erie High Tech Customer Buying Criteria Expectations Importance 1. Ideal Position Pfmn 10.9 Size 9.1 33% 2. Age Ideal Age = 0.0 29% 3. Price $25.00 - 45.00 25% 4. Reliability MTBF 17000-23000 13% Ferris 0% 20% 40% 60% 80% 100% Production Information Andrews Baldwin Chester Digby Erie Ferris Units Produced 6,081 1,287 1,287 3,478 2,475 1,683 2nd Shift Auto Unit & mation Capacity Primary Units Inven Age Pfmn Size Material Labor Contr. Over- Next Next Plant Name Segment Sold tory Revision Date Dec.31 MTBF Coord Coord Price Cost Cost Marg. time Round Round Utiliz. Able Anna Ash Axl Low High High High 2.999 1,013 929 758 0 237 71 74 12/20/2024 1/28/2026 6/1/2026 3/2/2026 4.1 20000 1.6 23000 1.1 23000 0.8 23000 6.9 10.6 10.7 10.6 13.1 $31.99 9.4 $42.09 9.2 $43.50 9.4 $44.39 $9.27 $3.96 $16.21 $10.91 $16.46 $12.54 $16.21 $11.88 57% 99% 33% 75% 33% 100% 35% 100% 10.0 3.5 3.0 3.0 1,805 199% 765 175% 750 200% 750 167% Baker Low 678 764 1/15/2023 8.1 20000 6.4 13.6 $34.00 $9.57 $10.80 30% 0% 3.0 1,423 90% Cake Low 679 747 11/21/2018 8.1 21000 6.4 13.6 $34.00 $9.87 $12.78 23% 63% 3.0 800 161% Daze Darcs Dior Desire Dallas Low High Low High Low 1,787 393 192 308 534 0 384 6 56 0 1/21/2027 11/2/2025 1/6/2027 5/21/2026 2/7/2026 3.5 17325 1.9 20000 1.7 16500 0.6 21500 0.9 18000 5.8 9.5 5.0 10.0 6.0 15.0 $32.00 $6.25 $6.70 10.5 $46.75 $13.65 $9.39 15.8 $30.00 $5.07 $10.73 9.5 $48.00 $15.31 $9.39 14.0 $32.50 $7.28 $9.39 58% 100% 43% 100% 46% 100% 47% 100% 48% 100% 7.0 5.0 3.0 5.0 6.0 900 199% 300 199% 100 199% 300 121% 300 178% Eat EatL Low High 1,485 0 465 1,557 4/1/2026 8/29/2026 1.7 16000 1.4 19000 73 11.0 12.7 $30.00 9.5 $43.90 $8.88 $8.04 $15.41 $7.05 43% 30% 11% 18% 4.0 5.0 1,350 110% 1,000 116% 4.9 Fast Feast High High 655 616 365 280 7/20/2026 7/20/2026 1.5 22000 1.2 22000 10.7 10.3 9.0 $42.50 $18.05 $8.83 9.5 $42.50 $17.22 $9.53 32% 34% 13% 42% 750 112% 750 140% 4.9 FOUNDATION FAST TRACK Page 4 Top Fast Track foundation Low Tech Market Segment Analysis F132438 Round: 5 December 31, 2026 Accessibility F132438 Low Tech Andrews Low Tech Statistics Total Industry Unit Demand Actual Industry Unit Sales Segment % of Total Industry Next Year's Segment Growth Rate 8,117 8,117 60.2% Baldwin Chester 10.0% Low Tech Customer Buying Criteria Expectations Importance 1. Price $15.00 - 35.00 41% 2. Age Ideal Age = 3.0 29% 3. Reliability MTBF 14000-20000 21% 4. Ideal Position Pfmn 7.3 Size 12.7 9% Digby Erie Ferris 0% 20% 40% 60% 80% 100% Income Statement Survey Sales Variable Costs (Labor, Material, Carry) Contribution Margin Depreciation SGA (R&D, Promo, Sales, Admin) Other (Fees, Writeoffs, TOM, Bonuses) EBIT Interest (Short term, Long term) Taxes Profit Sharing Net Profit FOUNDATION FAST TRACK Andrews $212,638 $118,715 $93,923 $8,355 $20,844 $6,238 $58,486 $5,628 $18,500 $687 $33,670 Baldwin $23,065 $16,120 $6,945 $1,708 $2,371 SO $2,866 $348 $882 $33 $1,604 Chester $23,100 $17,840 $5,260 $960 $2,372 $0 $1,928 $338 $557 $21 $1,013 Digby $113,443 $54,287 $59,156 $3,800 $23,134 $16.095 $16,127 $0 $5,644 $210 $10,273 Erie $64,987 $39,793 $25,194 $3,713 $8,396 $8,500 $4,585 $8,925 ($1,519) $0 ($2,821) Ferris $54,001 $36,347 $17.654 $2,467 $7,756 $74 $7,357 $2,590 $1,669 $62 $3,037 Page 3 Top Fast Track foundation Production Analysis F132438 Round: 5 December 31, 2026 Production vs Capacity F132438 Andrews Baldwin Chester Digby Erie Ferris 0 500 1,000 1,500 2.000 2,500 3,000 3,500 4,000 4,500 5,000 5,500 6,000 Capacity O Production F132438 Round: 5 December 31, 2026 Fast Track Andrews Baldwin Chester $33,670 $1,604 $1,013 Digby Erie Ferris $10,273 ($2,821) $3,037 Financial Summary Cash Flow Statement Survey Cash flows from operating activities Net Income (Loss) Adjustment for non-cash items: Depreciation Extraordinary gains/losses/writeoffs Changes in current assets and liabilities: Accounts payable Inventory Accounts receivable Net cash from operations $8,355 $0 $1,708 SO $960 $0 $3,800 $255 $3,713 $0 $2,467 $0 ($799) ($10,696) ($9,264) $21,266 ($67) ($12,655) $1,335 ($8,074) ($57) ($14,032) $1,360 ($10,756) $1.102 ($6,208) ($3,890) $5,331 ($871) ($10,902) $383 ($10,497) ($553) ($10,752) $1,547 ($4,254) ($43,700) SO $0 $0 ($7,815) ($3,900) ($6,000) Cash flows from investing activities Plant improvements (net) Cash flows from financing activities Dividends paid Sales of common stock Purchase of common stock Cash from long term debt issued Early retirement of long term debt Retirement of current debt Cash from current debt borrowing Cash from emergency loan Net cash from financing activities Net change in cash position Balance Sheet Survey Cash Accounts Receivable Inventory Total Current Assets $0 $0 ($2,500) $19.000 $0 ($1,733) $0 $1,613 SO SO SO SO SO ($1,733) SO SO $0 $0 $0 $0 $0 ($1,733) $0 $0 $0 $10,800 $0 $0 $0 ($3,624) $0 $0 $0 $0 $0 $20,000 $0 ($40,822) $0 $35,219 (543) $0 $0 $1,476 $0 ($12,235) $13,540 $0 $16,380 ($1,733) ($1,733) $7,176 $14,397 $2,738 ($6,054) ($9,807) ($12,489) $4,692 $0 Andrews $0 $26,216 $10,722 $36,938 Baldwin $8,004 $1,896 $16,001 $25,901 Chester $13,343 $1,899 $17,322 $32,564 Digby $4,692 $9,324 $10,576 $24,592 Erie $0 $5,341 $34,399 $39,740 ($7,516) Ferris $4,987 $4,438 $17.410 $26,836 Plant and equipment Accumulated Depreciation Total Fixed Assets $125,330 ($24,683) $100,647 $25,614 ($12,590) $13,024 $14,400 ($9,600) $4,800 $57.000 ($14,320) $42.680 $55,700 ($17,587) $38,113 $37,000 ($10,016) $26,984 Total Assets $137,585 $38,925 $37,364 $67 272 $77,854 $53,819 Accounts Payable Current Debt Total Current Liabilities $3,510 $1,613 $5,123 $2,207 SO $2,207 $2.449 $0 $2,449 $4,381 $0 $4,381 $3,827 $35,219 $39,046 $3,699 $13,540 $17,239 Long Term Debt Total Liabilities $51,574 $56,697 $2,700 $4,907 $2,600 $5,049 $3 $4,384 $22,600 $61,646 $10,553 $27,792 Common Stock Retained Earnings Total Equity $1,900 $78,989 $80,888 $2,323 $31,694 $34,017 $2,323 $29,992 $32,315 $28.251 $34.638 $62,888 $2,428 $13,780 $16,208 $3,149 $22,878 $26,028 Total Liabilities & Owners' Equity $137,585 $38.925 $37,364 $67,272 $77,854 $53,819 Closing Stock Price F132438 $120 $100 # Andrews Baldwin Chester Digby Erie Ferris $80 $60 $40 $20 SO 2021 2022 2023 2024 2025 2026 2027 2028 2029 Bond Market Summary Company Series# Face Yield Close$ S&P Andrews 13.0S2027 10.0S2032 10.582033 10.1S2034 10.082035 10.6S2036 $2,600,000 $2,480,000 $5,494,000 $7,500,000 $14,500,000 $19,000,000 12.7% 10.1% 10.4% 10.2% 10.2% 10.4% 102.45 98.70 100.96 98.94 98.29 101.82 BBB BBB BBB BBB BBB BBB Baldwin 13.0S2027 9.552033 $2,600,000 $100,000 12.5% 9.0% 104.24 105.65 AAA AAA Chester 13.0S2027 $2,600,000 12.5% 104.24 AAA Digby 13.0S2027 $3,135 12.5% 104.24 AAA Erie 13.0S2027 13.082036 $2,600,000 $20,000,000 13.0% 13.1% 99.82 98.92 DDD DDD Ferris 13.0S2027 10.0S2032 11.1S2033 11.1S2035 11.552036 $2,600,000 $420,545 $2,396,776 $3,658,939 $1,476,357 12.8% 10.6% 11.3% 11.3% 11.4% 101.44 94.14 98.60 98.36 100.58 B B B B B Next Year's Prime Rate 7.00% FOUNDATION FAST TRACK Page 2 Selected Financial Statistics Erie Andrews 15.8% 1.54 24.5% Baldwin 7.0% 0.59 4.1% Chester 4.4% 0.62 2.7% Digby 9.1% 1.69 15.3% -4.3% 0.83 -3.6% Ferris 5.6% 1.00 5.6% 1.7 1.1 1.2 1.1 4.8 2.1 ROS Asset Turnover ROA Leverage (Assets/Equity) ROE Emergency Loan Sales EBIT Profits Cumulative Profit SG&A/ Sales Contrib. Margin % 41.6% $1,612,978 $212,638,267 $58,485,591 $33,670,389 $78,028,258 9.8% 44.2% 4.7% $0 $23,064,552 $2,866,174 $1,604,395 $23,657,354 10.3% 30.1% 3.1% $0 $23,100,191 $1,928,288 $1,013,013 $21,954,878 10.3% 22.8% 16.3% $O $113,443,353 $16,126,785 $10,272,502 $28,696,232 20.4% 52.1% -17.4% $35,218,509 $64,987,224 $4,585,208 ($2,821,177) $5,742,723 12.9% 38.8% 11.7% $0 $54,000,593 $7,356,814 $3,036,766 $24,936,393 14.4% 32.7% Percent of Sales F132438 $ Market Share F132438 Profit Other O SGA Depr Var Costs 100% 90% 80% 70% 60% 50% 40% 30% 20% 10% 0% Andrews 43.29 % Baldwin 4.7% Chester 4.7 % Digby 23.09% Erie 13.23 % Ferris 10.99 % Andrews Chester Digby Erie Ferris FOUNDATION FAST TRACK Page 1 Top Foundation Round: 5 Stocks & Bonds Fast Track F132438 December 31, 2026 Close EPS Dividend Yield P/E Company Andrews Baldwin Chester Digby Erie Ferris - $105.07 $25.31 $22.51 $33.94 $1.00 $24.27 Stock Market Summary MarketCap Book Value Shares ($M) Per Share 1,848,339 $194 $43.76 2,000,000 $51 $17.01 2,000,000 $45 $16.16 2,947,263 $100 $21.34 2,016,001 $2 $8.04 2,052,992 $50 $12.68 Change $39.23 ($5.81) ($5.51) $11.80 $0.00 ($4.13) $18.22 $0.80 $0.51 $3.49 ($1.40) $1.48 $0.00 $0.00 $0.00 $0.00 $0.00 $0.02 0.0% 0.0% 0.0% 0.0% 0.0% 0.1% 5.8 31.5 44.4 9.7 -0.7 16.4
Step by Step Solution
There are 3 Steps involved in it

Get step-by-step solutions from verified subject matter experts