

Question: make an x bar and r chart with data explain steps please G GOG Lo 12 Calibri (Body) BIU EB ' a A ~ %
make an x bar and r chart with data 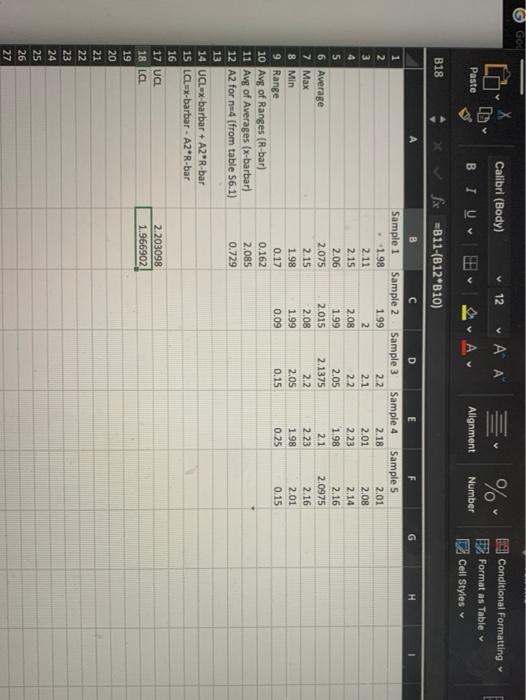
G GOG Lo 12 Calibri (Body) BIU EB ' a A ~ % Conditional Formatting Format as Table Cell Styles Paste Alignment Number B18 X fi =B11-(B12*B10) A G 1 B C D E F Sample 1 Sample 2 Sample 3 Sample 4 Sample 5 1.98 1.99 2.2 2.18 2.01 2.11 2 2.1 2.01 2.08 2.15 2.08 22 2.23 2.14 2.06 1.99 2.05 1.98 2.16 2.075 2015 2.1375 2.1 2.0975 2.15 2.08 2.2 2.23 2.16 1.98 1.99 2.05 1.98 2.01 0.17 0.09 0.15 0.25 0.15 0.162 2.085 0.729 6 Average 7 Max 8 Min 9 Range 10 Avg of Ranges (R-bar) 11 Avg of Averages (x-barbar) 12 A2 for n=4 (from table 56.1) 13 14 UCLwx-barbar + A2 R-bar 15 LCLEX-barbar - A2R-bar 16 17 UCL 18 L 19 20 21 22 23 24 25 26 27 2.203098 1.966902 explain steps please
Step by Step Solution
There are 3 Steps involved in it
1 Expert Approved Answer
Step: 1 Unlock

Question Has Been Solved by an Expert!
Get step-by-step solutions from verified subject matter experts
Step: 2 Unlock
Step: 3 Unlock